

Question: I need a proffessional correct answer. The Pareto chart indicates that most of the errors? I need a professional answer for this question I need
I need a proffessional correct answer.
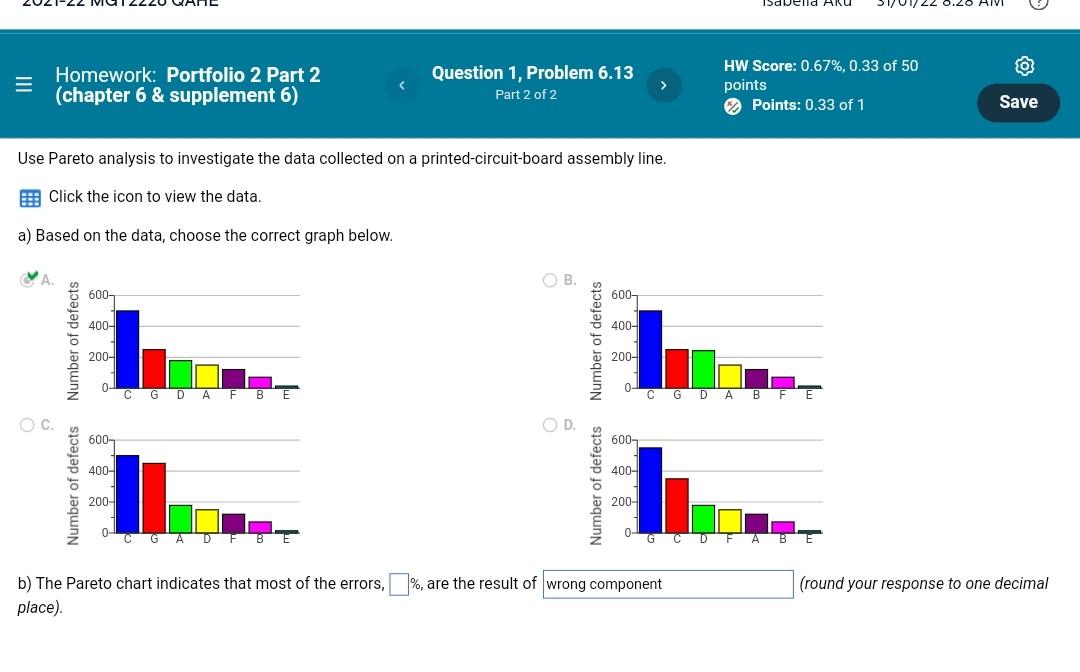
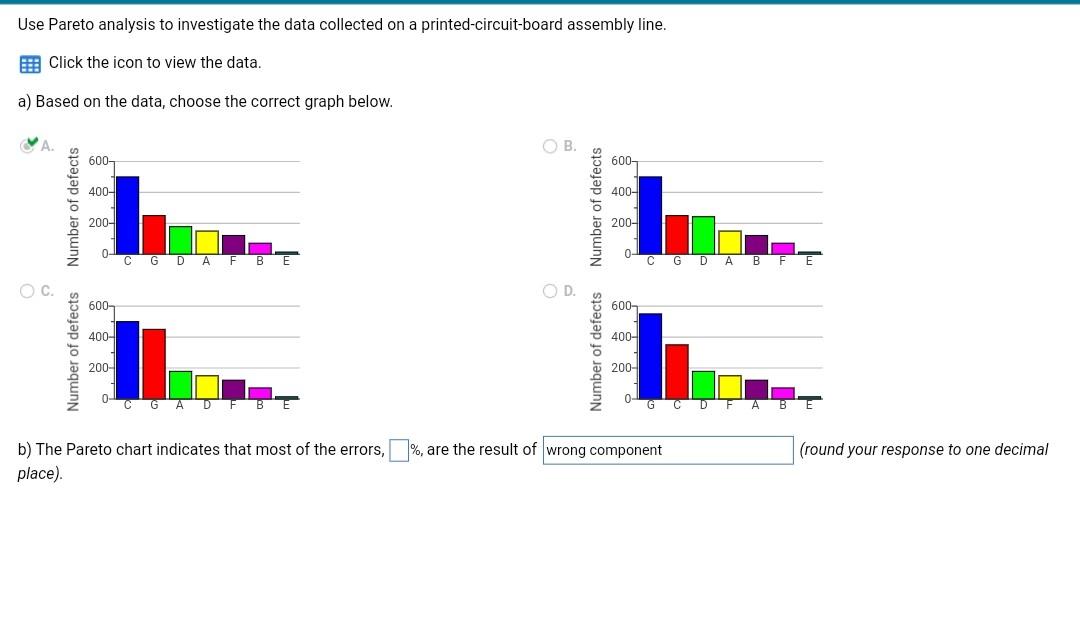
The Pareto chart indicates that most of the errors?
I need a professional answer for this question
I need a professional answer pls
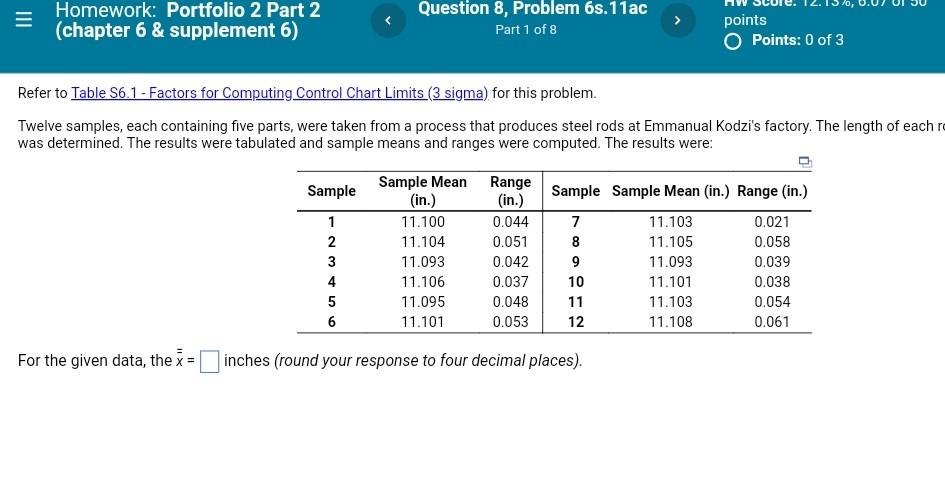
Isabelid AKU Homework: Portfolio 2 Part 2 (chapter 6 & supplement 6) HW Score: 0.67%, 0.33 of 50 points Points: 0.33 of 1 Save Use Pareto analysis to investigate the data collected on a printed-circuit-board assembly line. E Click the icon to view the data. a) Based on the data, choose the correct graph below. B. 600 6007 400- 400- 200- 2004 0- C G D A F B C G D A B F Number of defects Number of defects Number of defects Number of defects C. D. 6007 6007 400- 400- 200- 200- A D G D (round your response to one decimal b) The Pareto chart indicates that most of the errors, %, are the result of wrong component place) Use Pareto analysis to investigate the data collected on a printed circuit-board assembly line. E! Click the icon to view the data. a) Based on the data, choose the correct graph below. . 6007 600- 400- 400- Number of defects 200- 200- 0- 0- C G D AF BE C G D A B F E Number of defects Number of defects OC. OD D. 600 600 400- 400- Number of defects 200- 200- 0- 0 CGADBE G C D E A BE %, are the result of wrong component (round your response to one decimal b) The Pareto chart indicates that most of the errors, place) Homework: Portfolio 2 Part 2 (chapter 6 & supplement 6) Question 8, Problem 6s.11ac Part 1 of 8 points O Points: 0 of 3 Refer to Table 56.1 - Factors for Computing Control Chart Limits (3 sigma) for this problem. Twelve samples, each containing five parts, were taken from a process that produces steel rods at Emmanual Kodzi's factory. The length of each r was determined. The results were tabulated and sample means and ranges were computed. The results were: Sample 1 2 3 4 5 6 Sample Mean (in.) 11.100 11.104 11.093 11.106 11.095 11.101 Range (in.) 0.044 0.051 0.042 0.037 0.048 0.053 Sample Sample Mean (in.) Range (in.) 7 11.103 0.021 8 11.105 0.058 9 11.093 0.039 10 11.101 0.038 11 11.103 0.054 12 11.108 0.061 For the given data, the x = inches (round your response to four decimal places). Isabelid AKU Homework: Portfolio 2 Part 2 (chapter 6 & supplement 6) HW Score: 0.67%, 0.33 of 50 points Points: 0.33 of 1 Save Use Pareto analysis to investigate the data collected on a printed-circuit-board assembly line. E Click the icon to view the data. a) Based on the data, choose the correct graph below. B. 600 6007 400- 400- 200- 2004 0- C G D A F B C G D A B F Number of defects Number of defects Number of defects Number of defects C. D. 6007 6007 400- 400- 200- 200- A D G D (round your response to one decimal b) The Pareto chart indicates that most of the errors, %, are the result of wrong component place) Use Pareto analysis to investigate the data collected on a printed circuit-board assembly line. E! Click the icon to view the data. a) Based on the data, choose the correct graph below. . 6007 600- 400- 400- Number of defects 200- 200- 0- 0- C G D AF BE C G D A B F E Number of defects Number of defects OC. OD D. 600 600 400- 400- Number of defects 200- 200- 0- 0 CGADBE G C D E A BE %, are the result of wrong component (round your response to one decimal b) The Pareto chart indicates that most of the errors, place) Homework: Portfolio 2 Part 2 (chapter 6 & supplement 6) Question 8, Problem 6s.11ac Part 1 of 8 points O Points: 0 of 3 Refer to Table 56.1 - Factors for Computing Control Chart Limits (3 sigma) for this problem. Twelve samples, each containing five parts, were taken from a process that produces steel rods at Emmanual Kodzi's factory. The length of each r was determined. The results were tabulated and sample means and ranges were computed. The results were: Sample 1 2 3 4 5 6 Sample Mean (in.) 11.100 11.104 11.093 11.106 11.095 11.101 Range (in.) 0.044 0.051 0.042 0.037 0.048 0.053 Sample Sample Mean (in.) Range (in.) 7 11.103 0.021 8 11.105 0.058 9 11.093 0.039 10 11.101 0.038 11 11.103 0.054 12 11.108 0.061 For the given data, the x = inches (round your response to four decimal places)Step by Step Solution
There are 3 Steps involved in it
1 Expert Approved Answer
Step: 1 Unlock

Question Has Been Solved by an Expert!
Get step-by-step solutions from verified subject matter experts
Step: 2 Unlock
Step: 3 Unlock