

Question: Click the icon to view the data set. For the following data (a) display the data in a scatter plot, (b) calculate the sample
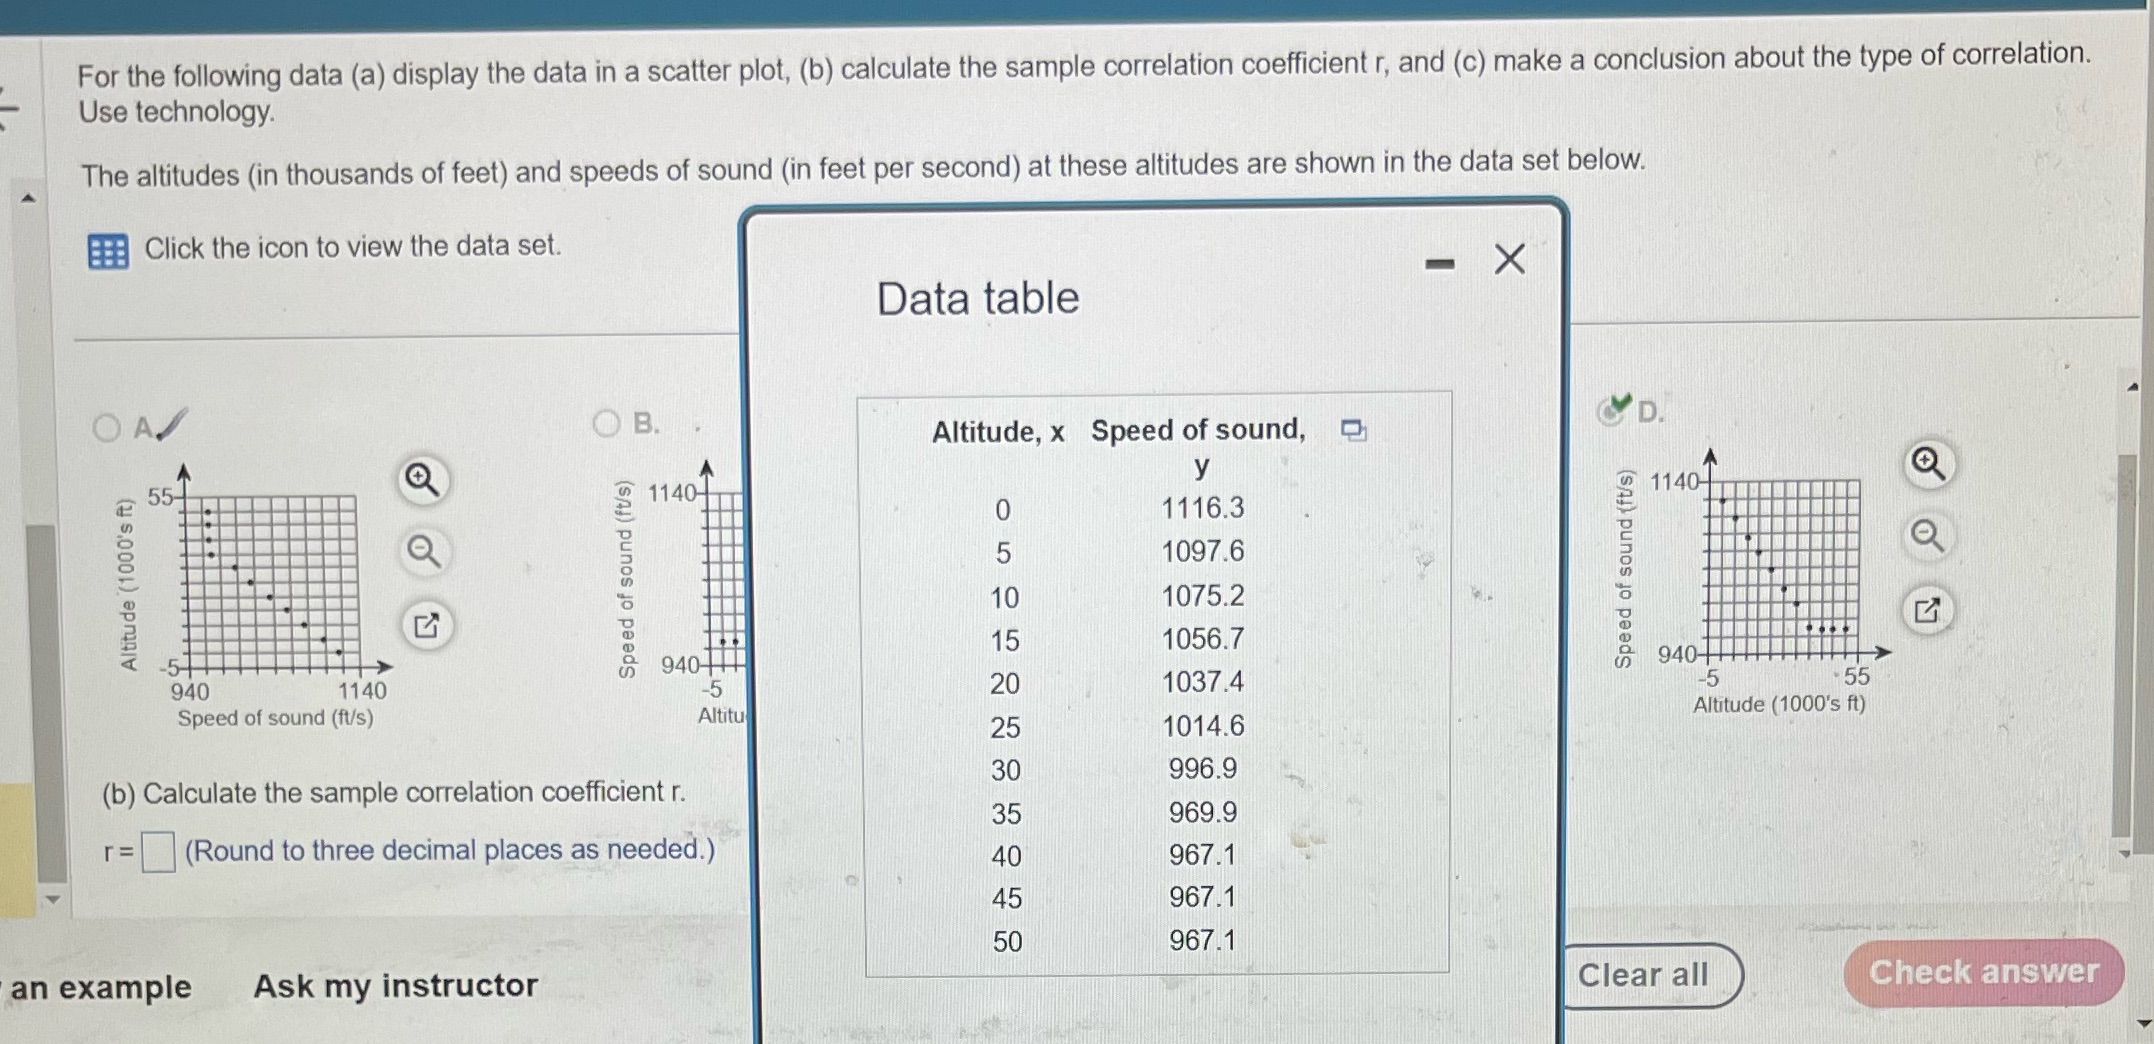
Click the icon to view the data set. For the following data (a) display the data in a scatter plot, (b) calculate the sample correlation coefficient r, and (c) make a conclusion about the type of correlation. Use technology. The altitudes (in thousands of feet) and speeds of sound (in feet per second) at these altitudes are shown in the data set below. OA Altitude (1000's ft) OB. Speed of sound (ft/s) 940 1140 Speed of sound (ft/s) (b) Calculate the sample correlation coefficient r. r = (Round to three decimal places as needed.) an example Ask my instructor Data table Altitude, x Speed of sound, n y 1140- 940- -5 Altitu 1525252525 0 1116.3 1097.6 10 1075.2 1056.7 Speed of sound (ft/s) D. 1140- G 20 1037.4 940+ -5 55 Altitude (1000's ft) 1014.6 30 996.9 35 969.9 40 967.1 45 967.1 50 967.1 Clear all Check answer
Step by Step Solution
There are 3 Steps involved in it

Get step-by-step solutions from verified subject matter experts