

Question: Click the icon to view the time series data. Find an exponential smoothing forecast for each period and fill-in the table below (enter your responses
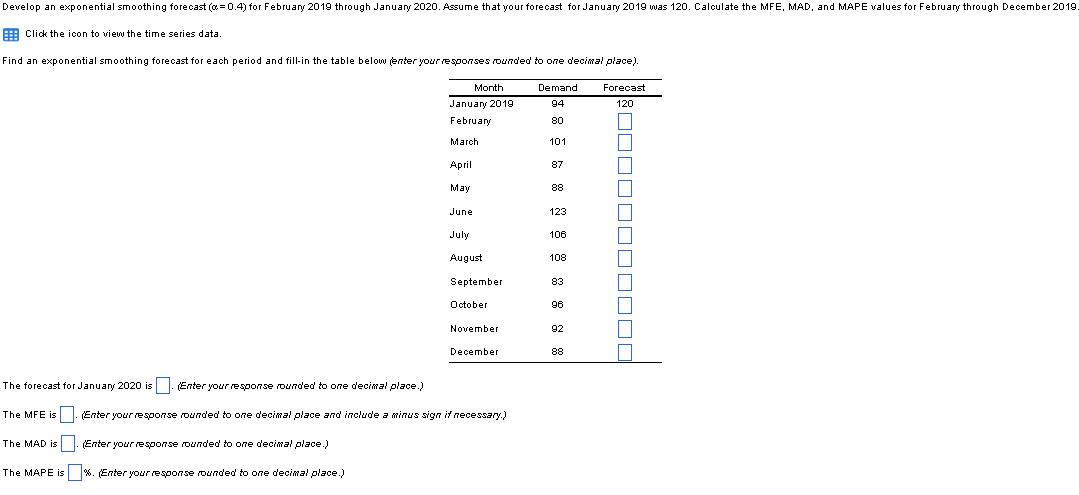
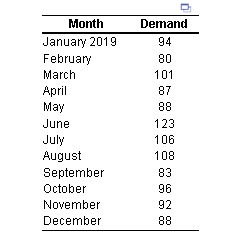
Click the icon to view the time series data. Find an exponential smoothing forecast for each period and fill-in the table below (enter your responses rounded to one decimal place). The forecast for Januany 2020 is (Enter yourresponse rounded to one decimal place.) The MFE is . (Enter yourresponse rounded to one decimal place and include a minus sign if necessary) The MAD is (Enter yourresponse rounded to one decimal place.) The MAPE is W. (Enter yourresoonse rounded to one decimal place.) \begin{tabular}{lc} \hline \multicolumn{1}{c}{ Month } & Demand \\ \hline January 2019 & 94 \\ February & 80 \\ March & 101 \\ April & 87 \\ May & 88 \\ June & 123 \\ July & 106 \\ August & 108 \\ September & 83 \\ October & 96 \\ November & 92 \\ December & 88 \\ \hline \end{tabular}
Step by Step Solution
There are 3 Steps involved in it

Get step-by-step solutions from verified subject matter experts