

Question: Click the Statistics pushhutton and make sure the following options are selected: Estimates, Model fit, part and partial correlation. colinearity diagnostics; then click Continue. Then
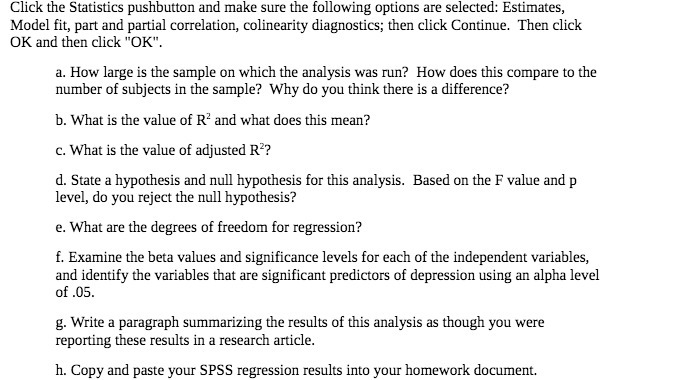
Click the Statistics pushhutton and make sure the following options are selected: Estimates, Model fit, part and partial correlation. colinearity diagnostics; then click Continue. Then click OK and then click "UK". a. How large is the sample on which the analysis was run? How does this compare to the number of subjects in the sample? Why do you think them is a difference? b. What is the value of It2 and what does this mean? c. What is the value of adjusted R1? d. State a hypothesis and null hypothesis for this analysis. Based on the F value and p lave], do you reject the null hypothesis? e. What are the degrees of freedom for regression? f. Examine the beta values and significance levels for each of the independent variables, and identify the variables that are signicant predictors of depression using an alpha level of .E. g. Write a paragraph summarizing the results of this analysis as though you were reporting these results in a research article. h. IEopy and paste your SPSS regression results into your homework document
Step by Step Solution
There are 3 Steps involved in it

Get step-by-step solutions from verified subject matter experts