

Question: Clipboard Font IV Alignment Formatting ver Table v Font IV Alignment Formatting ver Table v Font IV Alignment Formatting ver Table v Font IV Alignment
Clipboard
Font IV Alignment Formatting ver Table v
Font IV Alignment Formatting ver Table v
Font IV Alignment Formatting ver Table v
Font IV Alignment Formatting ver Table v
Number
Styles
G
A
B
C
D
E
F
G
G
J
H
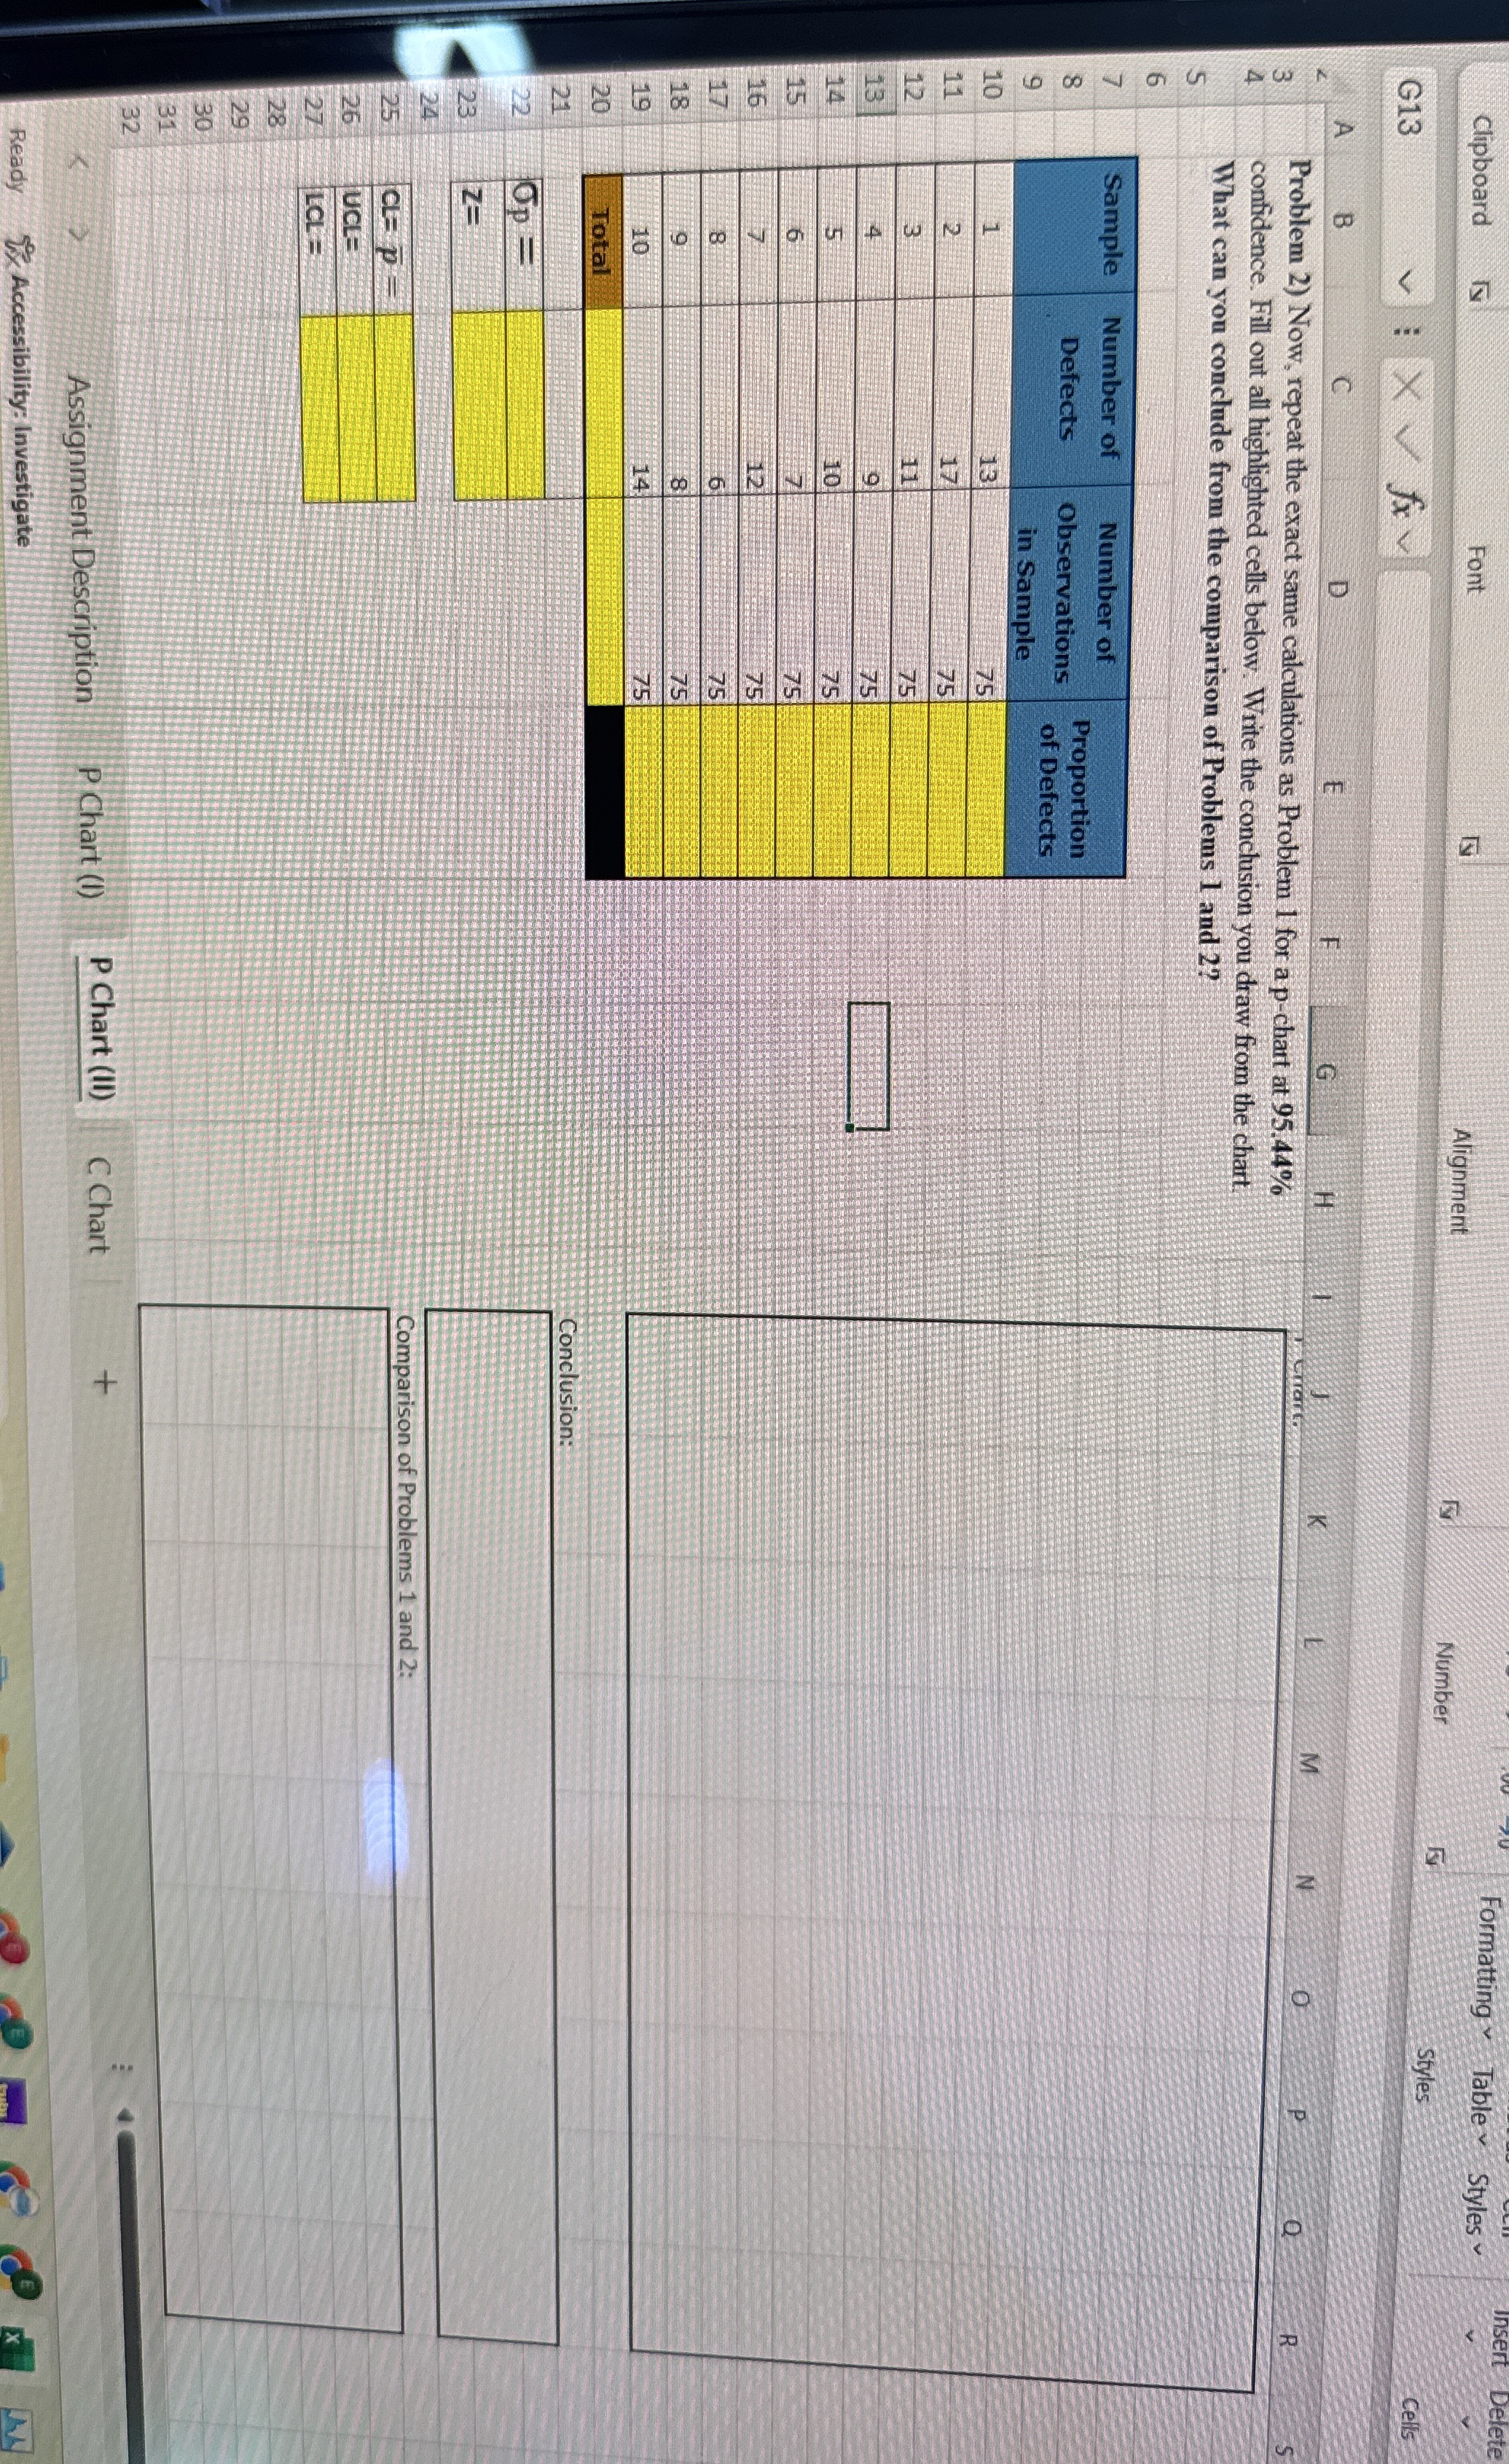
Problem Now, repeat the exact same calculations as Problem for a pchart at confidence. Fill out all highlighted cells below. Write the conclusion you draw from the chart What can you conclude from the comparison of Problems and
tableSampletableNumber ofDefectstableNumber ofObservationsin SampletableProportionof DefectsTotal
Conclusion:
Assignment Description
P Chart I
P Chart II
C Chart
Ready
Accessibility: Investigate
Step by Step Solution
There are 3 Steps involved in it
1 Expert Approved Answer
Step: 1 Unlock

Question Has Been Solved by an Expert!
Get step-by-step solutions from verified subject matter experts
Step: 2 Unlock
Step: 3 Unlock