

Question: CLO#3 (5 points) Use the figure below to answer the following questions: Annual Yield (%) Corporate Aaa Bonds 11 Corporate Baa Bonds U.S. Government Long-Term
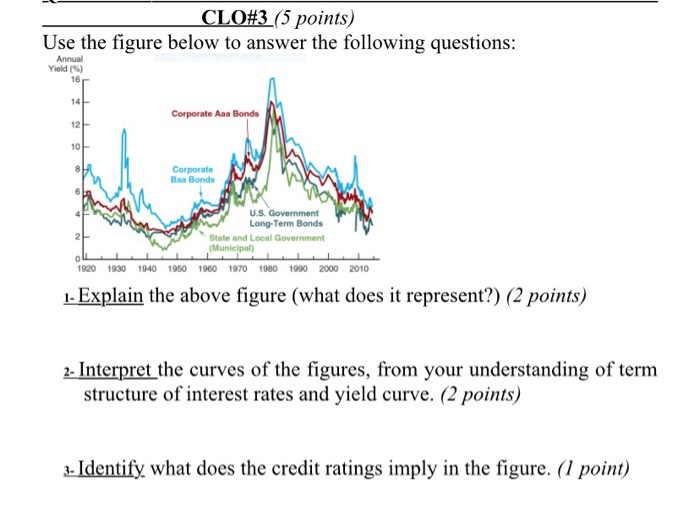
CLO#3 (5 points) Use the figure below to answer the following questions: Annual Yield (%) Corporate Aaa Bonds 11 Corporate Baa Bonds U.S. Government Long-Term Bonds State and Local Government Municipal L LL 1920 1930 1940 1950 1960 1970 1980 1990 2000 2010 1- Explain the above figure (what does it represent?) (2 points) 2- Interpret the curves of the figures, from your understanding of term structure of interest rates and yield curve. (2 points) 3- Identify what does the credit ratings imply in the figure. (1 point)
Step by Step Solution
There are 3 Steps involved in it
1 Expert Approved Answer
Step: 1 Unlock

Question Has Been Solved by an Expert!
Get step-by-step solutions from verified subject matter experts
Step: 2 Unlock
Step: 3 Unlock