

Question: close all; clear all; load broadbandl; % Load data (variable x) length(x) fs = 1000: Sampling frequency nfft = 128; Segment size for averaging PS
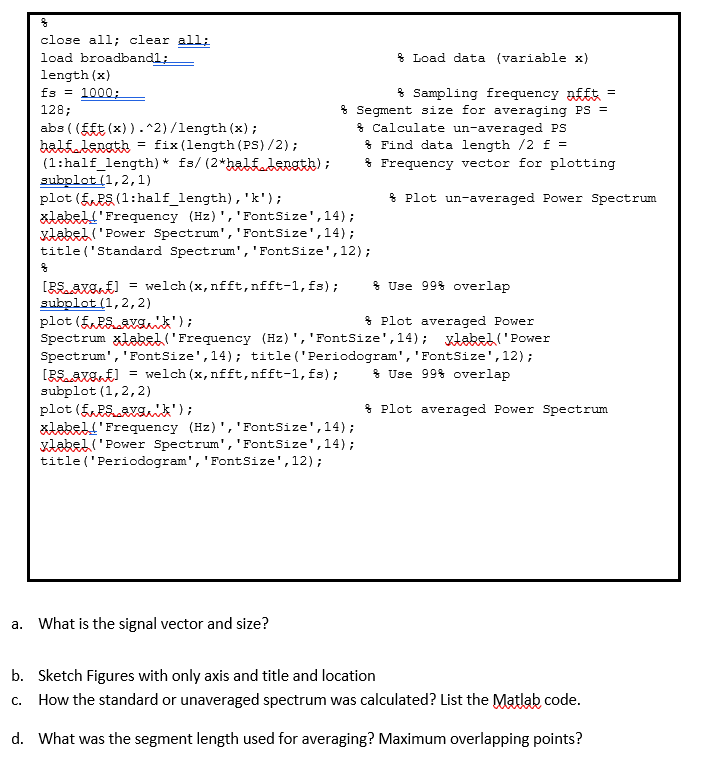
close all; clear all; load broadbandl; % Load data (variable x) length(x) fs = 1000: Sampling frequency nfft = 128; Segment size for averaging PS = abs ((Eft (x)).^2)/length(x); $ Calculate un-averaged PS half length fix (length(PS)/2); $ Find data length /2 f = (1:half_length)* fs/(2*halfadength); & Frequency vector for plotting subplot(1,2,1) plot (EFS(1:half_length), 'k'); Plot un-averaged Power Spectrum xabelt Frequency (Hz)', 'FontSize', 14); stabel('Power Spectrum', 'FontSize',14); title('Standard Spectrum', 'FontSize', 12); [PS.axs] = welch (x, nfft, nfft-1, f3); $ Use 99% overlap subplot (1,2,2) plot (EFS. avguk'); Plot averaged Power Spectrum stabel('Frequency (Hz)', 'FontSize',14); stabel('Power Spectrum', 'FontSize', 14); title('Periodogram', 'FontSize', 12); [PS.axs] = welch (x, nfft, nfft-1, f3); & Use 99% overlap subplot (1,2,2) plot (Ensavuk'); Plot averaged Power Spectrum xabelt Frequency (Hz)', 'FontSize', 14); stabel('Power Spectrum', 'FontSize', 14); title('Periodogram', 'FontSize', 12); a. What is the signal vector and size? b. Sketch Figures with only axis and title and location C. How the standard or unaveraged spectrum was calculated? List the Matlab code. d. What was the segment length used for averaging? Maximum overlapping points? close all; clear all; load broadbandl; % Load data (variable x) length(x) fs = 1000: Sampling frequency nfft = 128; Segment size for averaging PS = abs ((Eft (x)).^2)/length(x); $ Calculate un-averaged PS half length fix (length(PS)/2); $ Find data length /2 f = (1:half_length)* fs/(2*halfadength); & Frequency vector for plotting subplot(1,2,1) plot (EFS(1:half_length), 'k'); Plot un-averaged Power Spectrum xabelt Frequency (Hz)', 'FontSize', 14); stabel('Power Spectrum', 'FontSize',14); title('Standard Spectrum', 'FontSize', 12); [PS.axs] = welch (x, nfft, nfft-1, f3); $ Use 99% overlap subplot (1,2,2) plot (EFS. avguk'); Plot averaged Power Spectrum stabel('Frequency (Hz)', 'FontSize',14); stabel('Power Spectrum', 'FontSize', 14); title('Periodogram', 'FontSize', 12); [PS.axs] = welch (x, nfft, nfft-1, f3); & Use 99% overlap subplot (1,2,2) plot (Ensavuk'); Plot averaged Power Spectrum xabelt Frequency (Hz)', 'FontSize', 14); stabel('Power Spectrum', 'FontSize', 14); title('Periodogram', 'FontSize', 12); a. What is the signal vector and size? b. Sketch Figures with only axis and title and location C. How the standard or unaveraged spectrum was calculated? List the Matlab code. d. What was the segment length used for averaging? Maximum overlapping points
Step by Step Solution
There are 3 Steps involved in it

Get step-by-step solutions from verified subject matter experts