

Question: CLUSTER ANALYSIS EXAMINATION. FIRST PIC IS THE QUESTIONS TO BE ANSWERED SND SECOND PIC IS MY CLUSTER ANALYSIS 1) Examine the results of your cluster
CLUSTER ANALYSIS EXAMINATION. FIRST PIC IS THE QUESTIONS TO BE ANSWERED SND SECOND PIC IS MY CLUSTER ANALYSIS 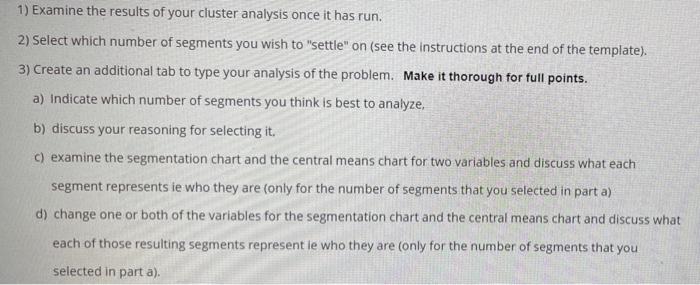
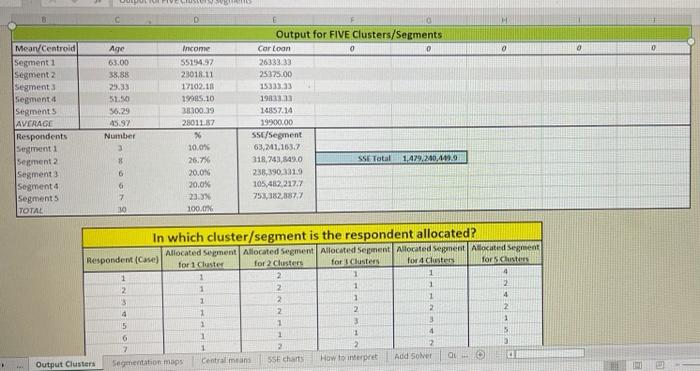
1) Examine the results of your cluster analysis once it has run. 2) Select which number of segments you wish to "settle" on (see the instructions at the end of the template). 3) Create an additional tab to type your analysis of the problem. Make it thorough for full points. a) Indicate which number of segments you think is best to analyze, b) discuss your reasoning for selecting it. c) examine the segmentation chart and the central means chart for two variables and discuss what each segment represents ie who they are (only for the number of segments that you selected in part a) d) change one or both of the variables for the segmentation chart and the central means chart and discuss what each of those resulting segments represent le who they are (only for the number of segments that you selected in part a). K Mean/Centroid Segment 1 Segment 2 Segment 3 Segment 4 Segment s AVERAGE Respondents Segment 1 Segment 2 Segment 31 Segment 4 S Segment TOTAL W Age 63.00 38.88 29.33 51.50 36.29 45.97 Number 8 Output Clusters 10 Output for FIVE Clusters/Segments Income Car Loan 0 55194.97 26333.33 23018.11 25375.00 17102.18 15333.33 19985.10 19833.33 38300.39 14857.14 28011.87 19900.00 % SSC/Segment 10.0% 63,241,163.7 26.7% 318,743,849.0 SSE Total 1,479,240,449.0 20.0% 238,390,331.9 20.0% 105,482,217.7 23.3% 753,382,887.7 100.0% In which cluster/segment is the respondent allocated? Allocated Segment Allocated Segment Allocated Segment Allocated Segment Allocated Segment for 1 Cluster for 3 Clusters for 4 Clusters for 5 Clusters for 2 Clusters 1 2 4 1 1 2 1 4 2 1 5 3 6 6 7 30 Respondent (Case) 1 2 3 4 5 6 7 Segmentation maps 1 1 1 1 1 1 Central means 2 2 2 1 1 2 SSE charts 1 2 3 1 2 How to interpret 1 2 3 4 Add Solver QO C 0 0 1) Examine the results of your cluster analysis once it has run. 2) Select which number of segments you wish to "settle" on (see the instructions at the end of the template). 3) Create an additional tab to type your analysis of the problem. Make it thorough for full points. a) Indicate which number of segments you think is best to analyze, b) discuss your reasoning for selecting it. c) examine the segmentation chart and the central means chart for two variables and discuss what each segment represents ie who they are (only for the number of segments that you selected in part a) d) change one or both of the variables for the segmentation chart and the central means chart and discuss what each of those resulting segments represent le who they are (only for the number of segments that you selected in part a). K Mean/Centroid Segment 1 Segment 2 Segment 3 Segment 4 Segment s AVERAGE Respondents Segment 1 Segment 2 Segment 31 Segment 4 S Segment TOTAL W Age 63.00 38.88 29.33 51.50 36.29 45.97 Number 8 Output Clusters 10 Output for FIVE Clusters/Segments Income Car Loan 0 55194.97 26333.33 23018.11 25375.00 17102.18 15333.33 19985.10 19833.33 38300.39 14857.14 28011.87 19900.00 % SSC/Segment 10.0% 63,241,163.7 26.7% 318,743,849.0 SSE Total 1,479,240,449.0 20.0% 238,390,331.9 20.0% 105,482,217.7 23.3% 753,382,887.7 100.0% In which cluster/segment is the respondent allocated? Allocated Segment Allocated Segment Allocated Segment Allocated Segment Allocated Segment for 1 Cluster for 3 Clusters for 4 Clusters for 5 Clusters for 2 Clusters 1 2 4 1 1 2 1 4 2 1 5 3 6 6 7 30 Respondent (Case) 1 2 3 4 5 6 7 Segmentation maps 1 1 1 1 1 1 Central means 2 2 2 1 1 2 SSE charts 1 2 3 1 2 How to interpret 1 2 3 4 Add Solver QO C 0 0 Step by Step Solution
There are 3 Steps involved in it
1 Expert Approved Answer
Step: 1 Unlock

Question Has Been Solved by an Expert!
Get step-by-step solutions from verified subject matter experts
Step: 2 Unlock
Step: 3 Unlock