

Question: CM-Conn... Given the following box plot: + + 0 2 Determine the following: a. Min = b. Q = c. Median = d. Q3
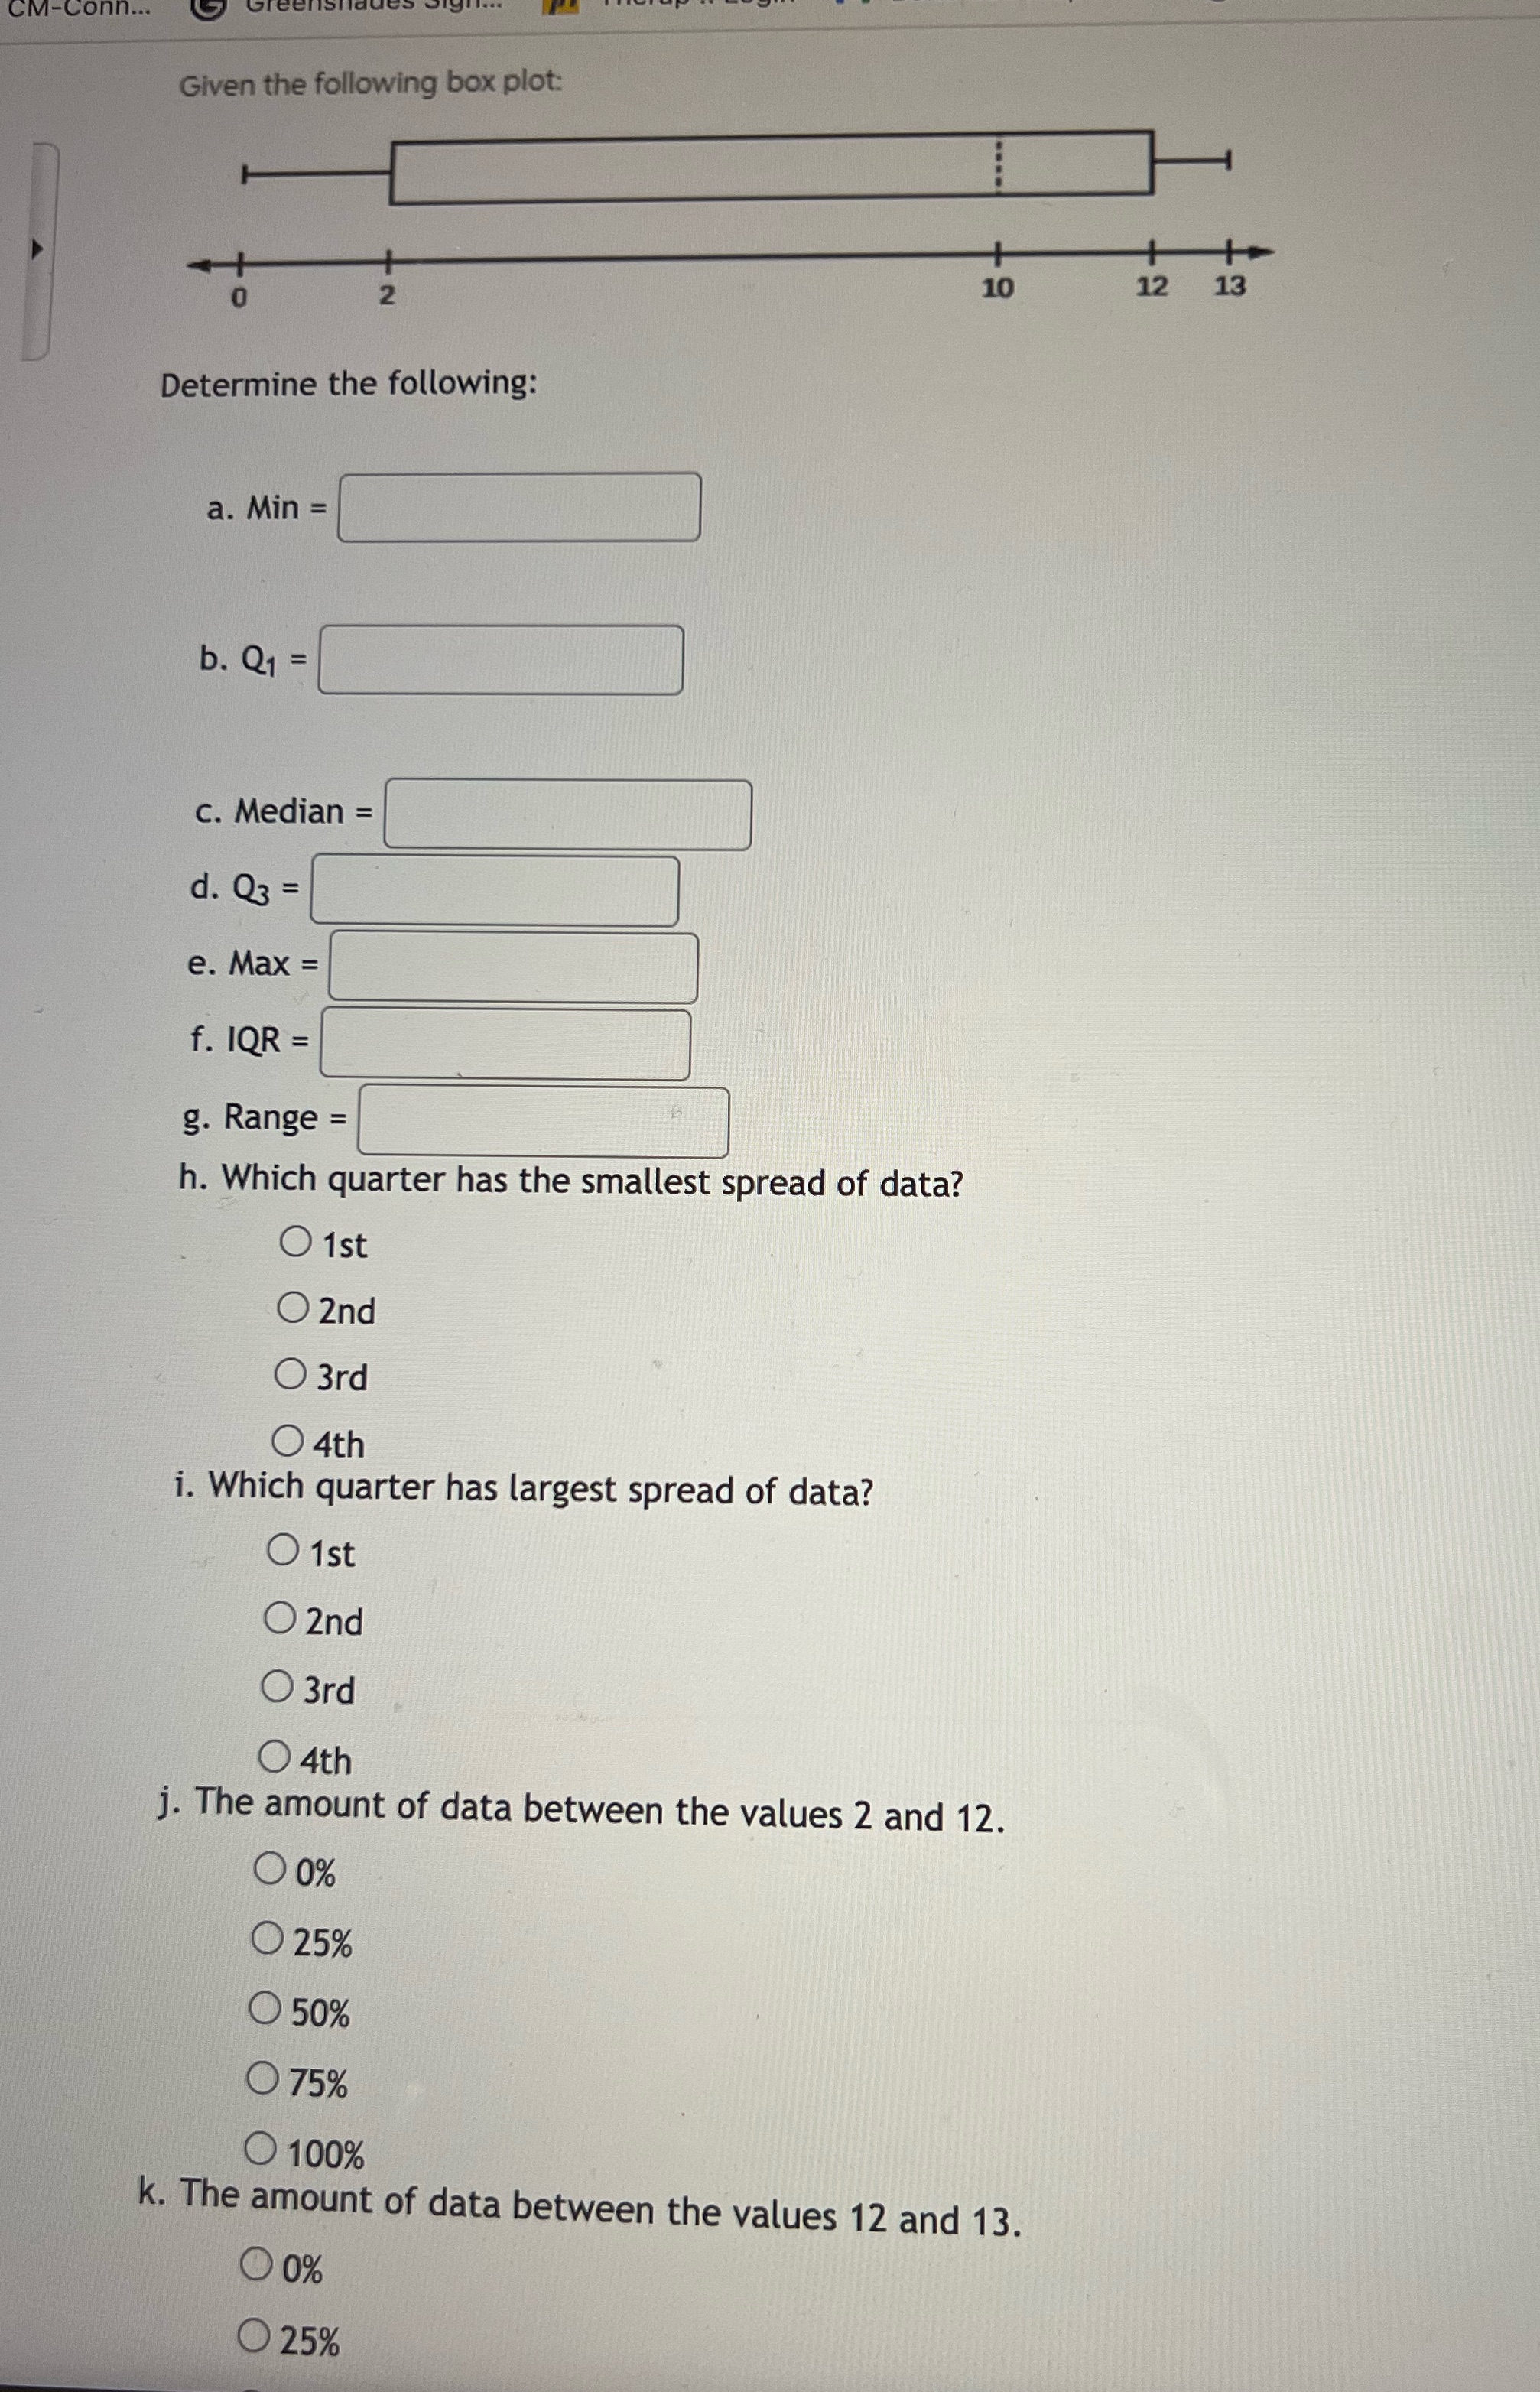
CM-Conn... Given the following box plot: + + 0 2 Determine the following: a. Min = b. Q = c. Median = d. Q3 = e. Max = f. IQR = = g. Range = 10 10 h. Which quarter has the smallest spread of data? 1st 2nd 3rd 4th i. Which quarter has largest spread of data? 1st 2nd 3rd 4th j. The amount of data between the values 2 and 12. 0% 25% 50% + 12 75% 100% k. The amount of data between the values 12 and 13. 0% 25% 13
Step by Step Solution
There are 3 Steps involved in it
1 Expert Approved Answer
Step: 1 Unlock

Question Has Been Solved by an Expert!
Get step-by-step solutions from verified subject matter experts
Step: 2 Unlock
Step: 3 Unlock