Question: CMR case, Supply Chain Strategy, Please fill out the table and find EBIT. Thank you! There are several parts to this assignment: 1. Manufacturing contribution:
CMR case, Supply Chain Strategy, Please fill out the table and find EBIT.
Thank you!
There are several parts to this assignment:
1. Manufacturing contribution: basically you calculate the revenue and variable manufacturing costs (materials plus labor).
2. The 3 Scenarios:
a) You take the remaining overhead and spread it based on the revenue each segment produces (so residential gets 18% of the overhead costs allocated - regardless of what they do).
b) You take indirect labor and look into how many employees worked in the different segments (for example one person worked just on Blackstone). Then you assign that indirect labor (the salary) to that segment. The remaining overhead is allocated as in scenario 1.
c) You do the same as in b) but you do not allocate any other overhead.
That is it!
P.S. if you look carefully, there are hidden cells which might have some good information.
Please see the files you need to complete the assignment:
CMR Enterprises - spreadsheet for students-1.xlsx Download CMR Enterprises - spreadsheet for students-1.xlsx
- CMR_Enterprises-Spreadsheet Data Sources-1.docx
- CMR FAQs-1.docx
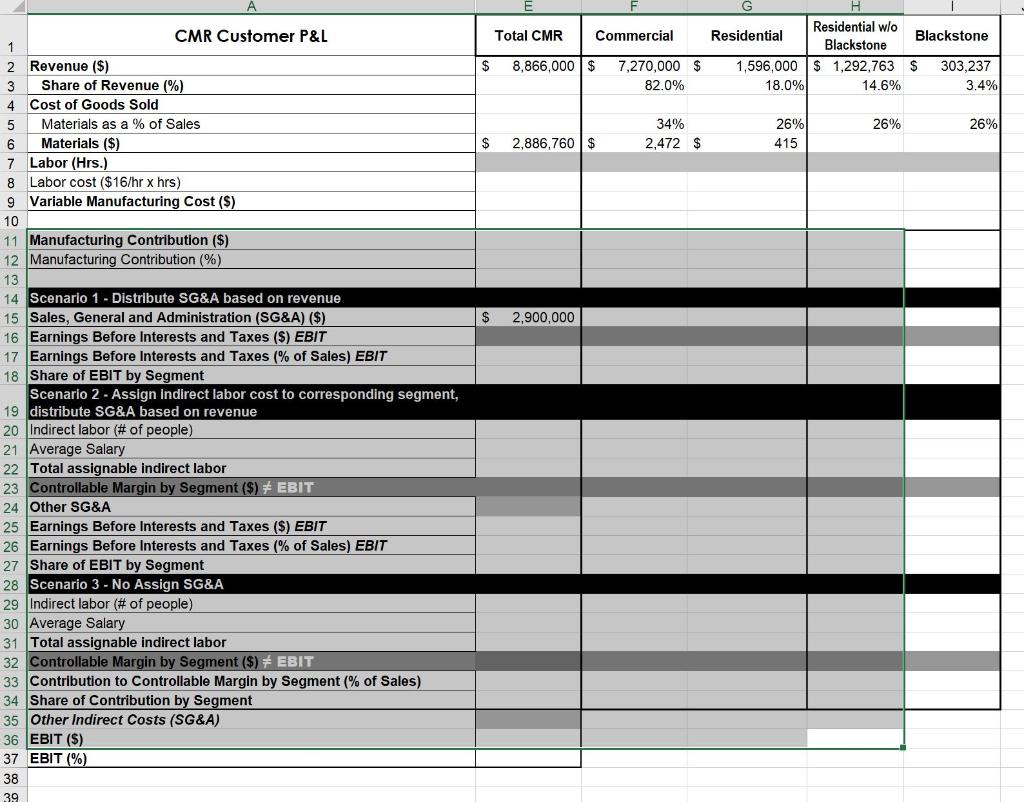
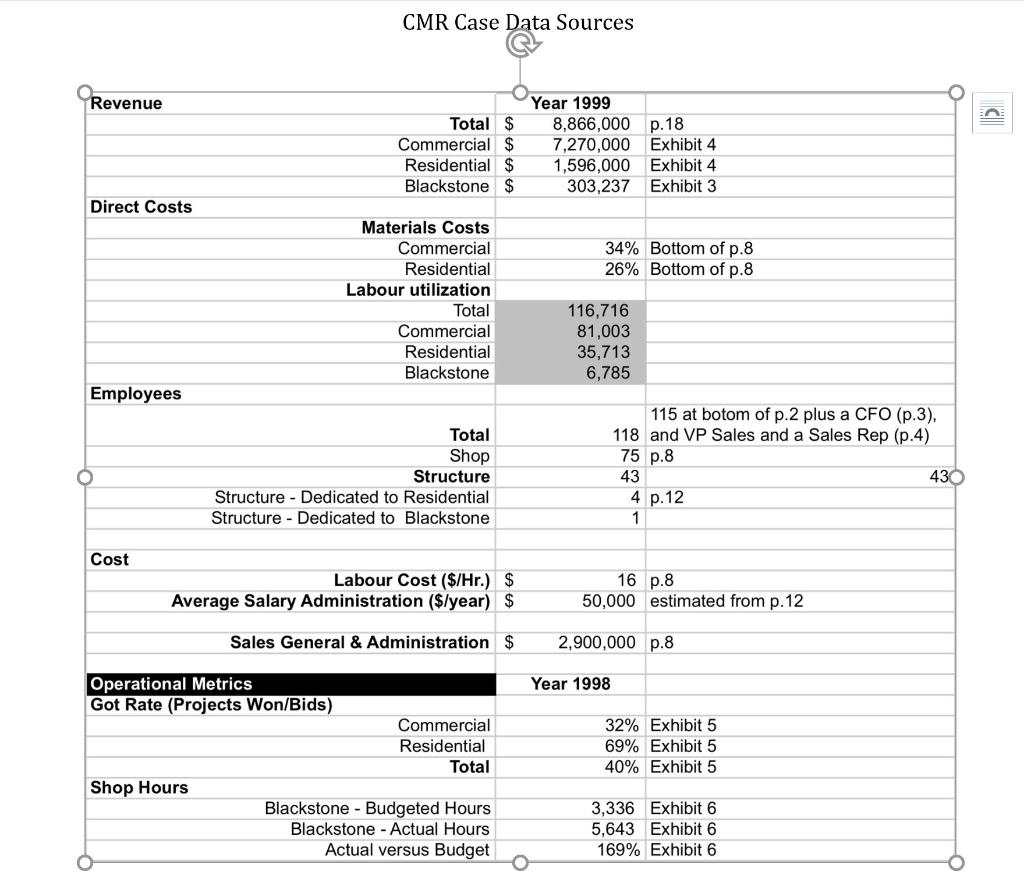
1) Are you sure that Blackstone materials as % of sales is 26% only? This was the same percentage as residential. This info was given in case spreadsheet. The information is correct. There is nothing different for the cabinets they make for Blackstone versus the cabinets they make for other customers. To get the amount of materials used you multiply the 26% by the amount of sales. For the entire residential market it is 26% vs 34% for the entire commercial market. 2) There were 118 employees but 75 worked in the shop. That means 43 employees did not work directly on the product. And SG&A is a non-manufacturing cost. But in terms of scenario 2, the case does not say how many people worked in different categories. Therefore, I cannot calculate average salary. See the 'data sources' document. There were 39 people working on the commercial market. Therefore the remaining four work for the residential segment overall and one for Blackstone (also see case page 12) 3) What does 81,003 of labor utilization mean for the commercial? It is how many hours were used of the total labor pool (hint: multiply by the total labor spending) 4) Can you please explain scenario 2 because I dont understand it since it is indirect labor but distribute SG&A based on revenue So, you distribute indirect labor between the two segments (commercial and residential). We then assume we pay them $50,000 (on average) and that gives us a total of 2.15M for salaries and the remaining 750k go into the allocation pool, which are then allocated to the segments as a percentage of sales.
-234 1 CMR Customer P&L Revenue ($) Share of Revenue (%) Cost of Goods Sold 5 Materials as a % of Sales 6 Materials ($) 7 Labor (Hrs.) 8 Labor cost ($16/hr x hrs) 9 Variable Manufacturing Cost ($) 10 11 Manufacturing Contribution ($) 12 Manufacturing Contribution (%) 13 14 Scenario 1 - Distribute SG&A based on revenue 15 Sales, General and Administration (SG&A) ($) 16 Earnings Before Interests and Taxes ($) EBIT 17 Earnings Before Interests and Taxes (% of Sales) EBIT 18 Share of EBIT by Segment Scenario 2 - Assign indirect labor cost to corresponding segment, 19 distribute SG&A based on revenue 20 Indirect labor (# of people) 21 Average Salary 22 Total assignable indirect labor 23 Controllable Margin by Segment ($)# EBIT 24 Other SG&A 25 Earnings Before Interests and Taxes ($) EBIT 26 Earnings Before Interests and Taxes (% of Sales) EBIT 27 Share of EBIT by Segment 28 Scenario 3 - No Assign SG&A 29 Indirect labor (# of people) 30 Average Salary 31 Total assignable indirect labor 32 Controllable Margin by Segment ($) # EBIT 33 Contribution to Controllable Margin by Segment (% of Sales) 34 Share of Contribution by Segment 35 Other Indirect Costs (SG&A) 36 EBIT ($) 37 EBIT (%) 38 39 Commercial 8,866,000 $ 7,270,000 $ 82.0% 34% 2,472 $ Total CMR $ $ 2,886,760 $ $ 2,900,000 Residential w/o Blackstone Blackstone 1,596,000 $ 1,292,763 $ 303,237 18.0% 14.6% 3.4% 26% 26% 26% 415 Residential Revenue Direct Costs Employees Cost Operational Metrics Got Rate (Projects Won/Bids) Shop Hours CMR Case Data Sources Year 1999 Total $ 8,866,000 Commercial $ 7,270,000 Residential $ 1,596,000 Blackstone $ 303,237 Materials Costs Commercial Residential Labour utilization Total Commercial Residential Blackstone Total Shop Structure Structure Dedicated to Residential Structure Dedicated to Blackstone Labour Cost ($/Hr.) S Average Salary Administration ($/year) $ Sales General & Administration $ Commercial Residential Total Blackstone Budgeted Hours Blackstone - Actual Hours Actual versus Budget p.18 Exhibit 4 Exhibit 4 Exhibit 3 34% Bottom of p.8 26% Bottom of p.8 116,716 81,003 35,713 6,785 115 at botom of p.2 plus a CFO (p.3), 118 and VP Sales and a Sales Rep (p.4) 75 p.8 43 430 4 p.12 1 16 p.8 50,000 estimated from p.12 2,900,000 p.8 Year 1998 32% Exhibit 5 69% Exhibit 5 40% Exhibit 5 3,336 Exhibit 6 5,643 Exhibit 6 169% Exhibit 6 -234 1 CMR Customer P&L Revenue ($) Share of Revenue (%) Cost of Goods Sold 5 Materials as a % of Sales 6 Materials ($) 7 Labor (Hrs.) 8 Labor cost ($16/hr x hrs) 9 Variable Manufacturing Cost ($) 10 11 Manufacturing Contribution ($) 12 Manufacturing Contribution (%) 13 14 Scenario 1 - Distribute SG&A based on revenue 15 Sales, General and Administration (SG&A) ($) 16 Earnings Before Interests and Taxes ($) EBIT 17 Earnings Before Interests and Taxes (% of Sales) EBIT 18 Share of EBIT by Segment Scenario 2 - Assign indirect labor cost to corresponding segment, 19 distribute SG&A based on revenue 20 Indirect labor (# of people) 21 Average Salary 22 Total assignable indirect labor 23 Controllable Margin by Segment ($)# EBIT 24 Other SG&A 25 Earnings Before Interests and Taxes ($) EBIT 26 Earnings Before Interests and Taxes (% of Sales) EBIT 27 Share of EBIT by Segment 28 Scenario 3 - No Assign SG&A 29 Indirect labor (# of people) 30 Average Salary 31 Total assignable indirect labor 32 Controllable Margin by Segment ($) # EBIT 33 Contribution to Controllable Margin by Segment (% of Sales) 34 Share of Contribution by Segment 35 Other Indirect Costs (SG&A) 36 EBIT ($) 37 EBIT (%) 38 39 Commercial 8,866,000 $ 7,270,000 $ 82.0% 34% 2,472 $ Total CMR $ $ 2,886,760 $ $ 2,900,000 Residential w/o Blackstone Blackstone 1,596,000 $ 1,292,763 $ 303,237 18.0% 14.6% 3.4% 26% 26% 26% 415 Residential Revenue Direct Costs Employees Cost Operational Metrics Got Rate (Projects Won/Bids) Shop Hours CMR Case Data Sources Year 1999 Total $ 8,866,000 Commercial $ 7,270,000 Residential $ 1,596,000 Blackstone $ 303,237 Materials Costs Commercial Residential Labour utilization Total Commercial Residential Blackstone Total Shop Structure Structure Dedicated to Residential Structure Dedicated to Blackstone Labour Cost ($/Hr.) S Average Salary Administration ($/year) $ Sales General & Administration $ Commercial Residential Total Blackstone Budgeted Hours Blackstone - Actual Hours Actual versus Budget p.18 Exhibit 4 Exhibit 4 Exhibit 3 34% Bottom of p.8 26% Bottom of p.8 116,716 81,003 35,713 6,785 115 at botom of p.2 plus a CFO (p.3), 118 and VP Sales and a Sales Rep (p.4) 75 p.8 43 430 4 p.12 1 16 p.8 50,000 estimated from p.12 2,900,000 p.8 Year 1998 32% Exhibit 5 69% Exhibit 5 40% Exhibit 5 3,336 Exhibit 6 5,643 Exhibit 6 169% Exhibit 6


