

Question: Cobjective: O O As mentioned in the last deliverable, one part of the CONTROL phase of DMAIC is to to use the control chart to
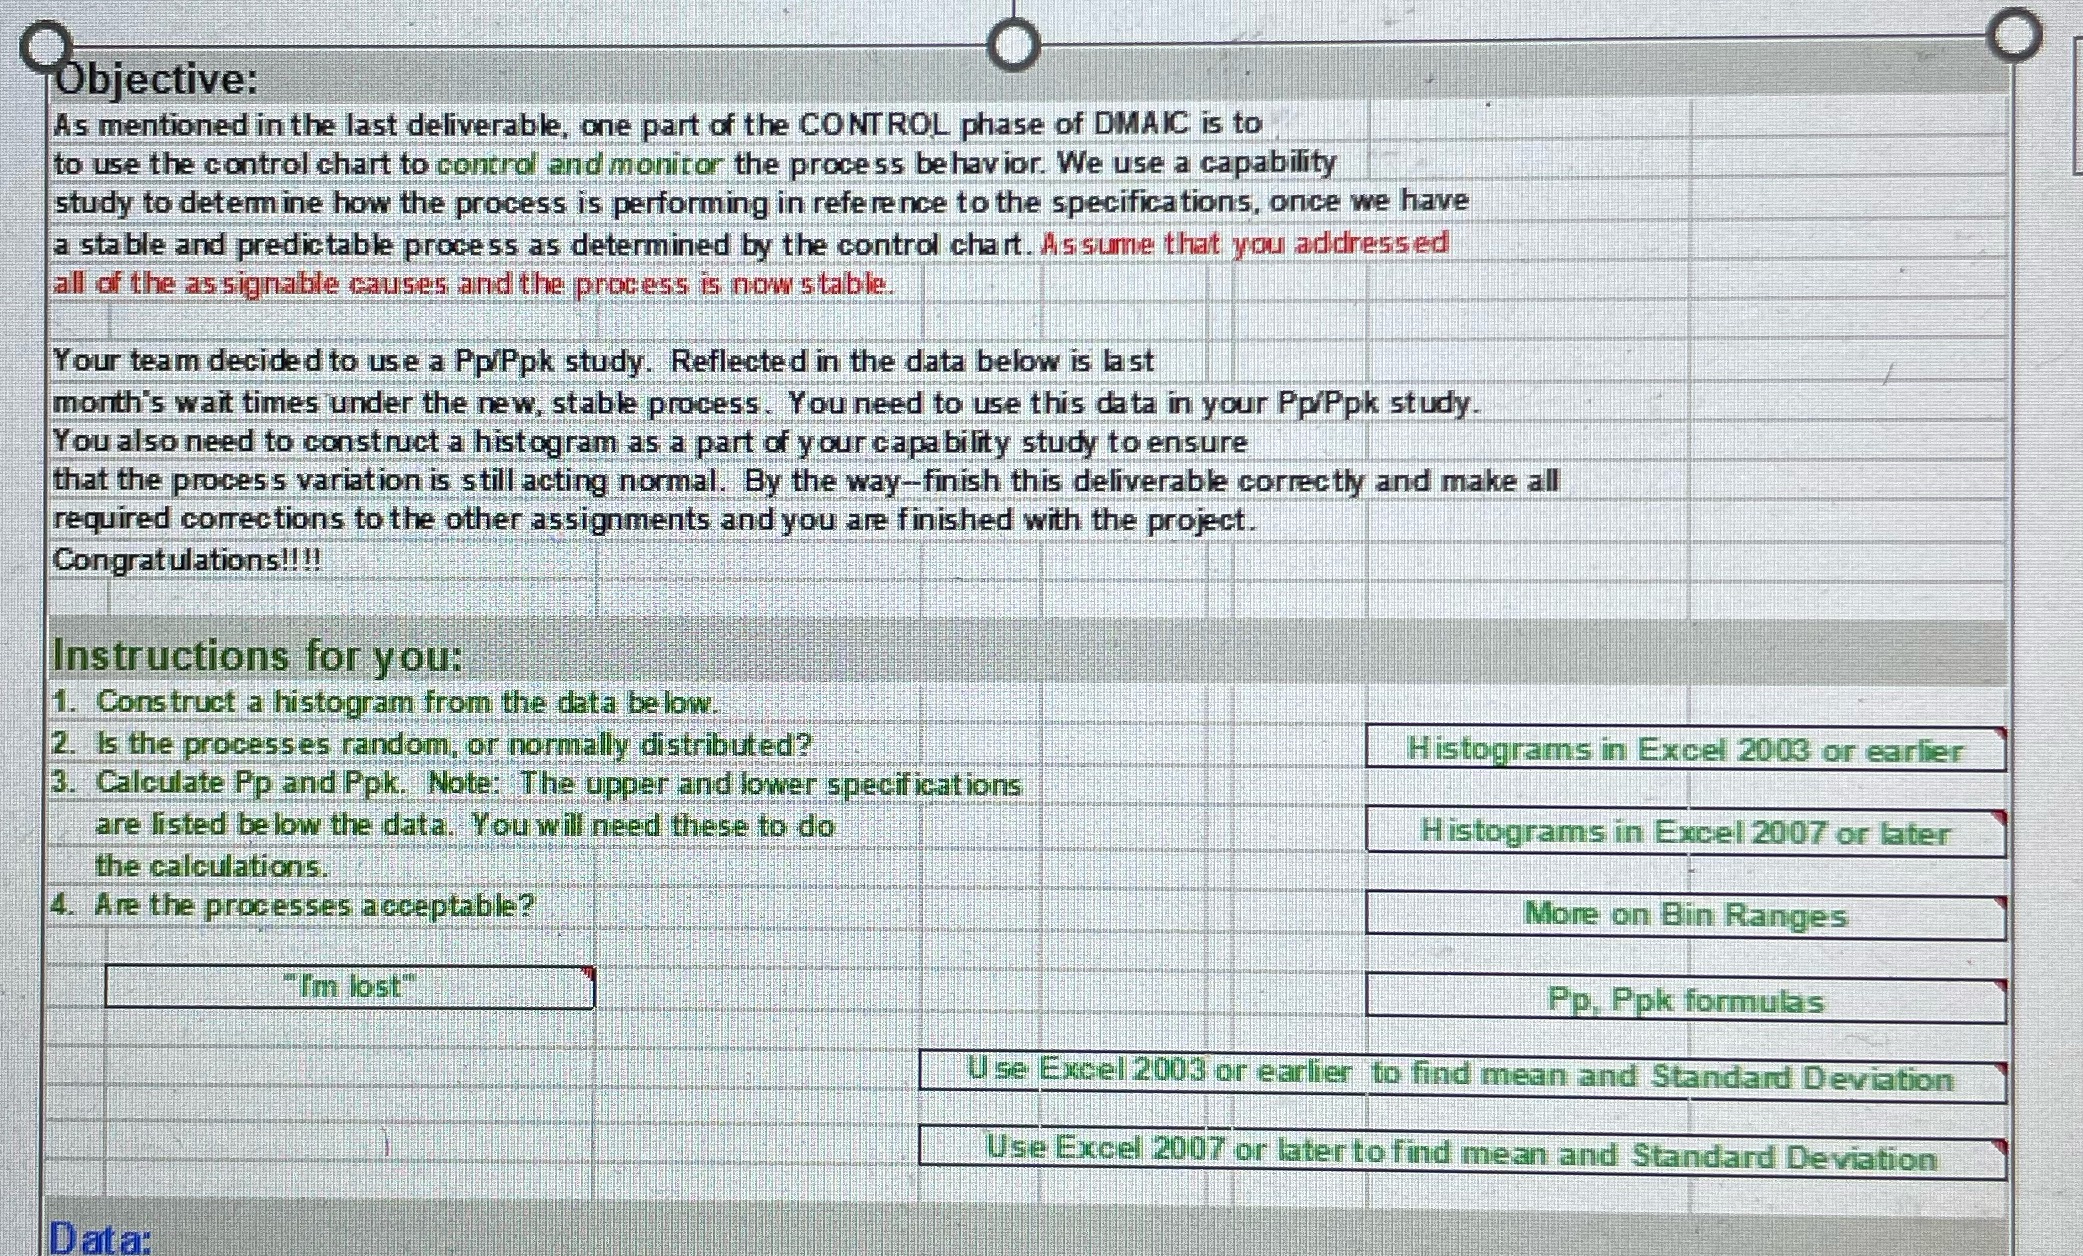
Cobjective: O O As mentioned in the last deliverable, one part of the CONTROL phase of DMAIC is to to use the control chart to control and monitor the process behavior. We use a capability study to determine how the process is performing in reference to the specifications, once we have a stable and predictable process as determined by the control chart. Assume that you addressed all of the as signable causes and the process is now stable. Your team decided to use a Pp Ppk study. Reflected in the data below is last month's wait times under the new, stable process. You need to use this data in your Pp/Ppk study. You also need to construct a histogram as a part of your capability study to ensure that the process variation is still acting normal. By the way-finish this deliverable correctly and make all required corrections to the other assignments and you are finished with the project. Congratulations!! !! Instructions for you: 1. Construct a histogram from the data be low. 2. Is the processes random, or normally distributed? Histograms in Excel 2003 or earlier 3. Calculate Pp and Ppk. Note: The upper and lower specifications are listed below the data. You will need these to do Histograms in Excel 2007 or later the calculations. Are the processes acceptable? More on Bin Ranges "I'm lost" Pp Ppk formulas Use Excel 2003 or earlier to find mean and Standard Deviation Use Excel 2007 or later to find mean and Standard Deviation Data
Step by Step Solution
There are 3 Steps involved in it

Get step-by-step solutions from verified subject matter experts