

Question: Create a vertical (same-size) & horizontal analysis (change in dollars and percent of change) for Coca-Cola and Pepsi, for 2016 and 2017. Also, calculate
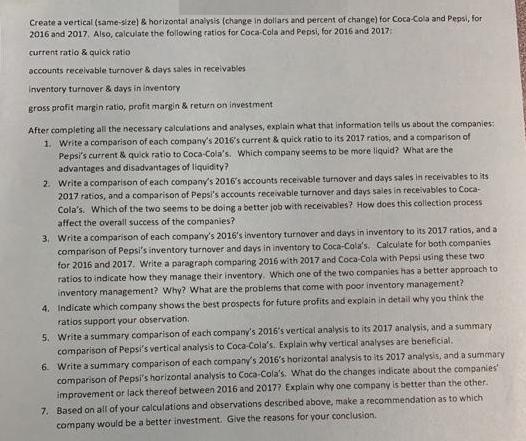
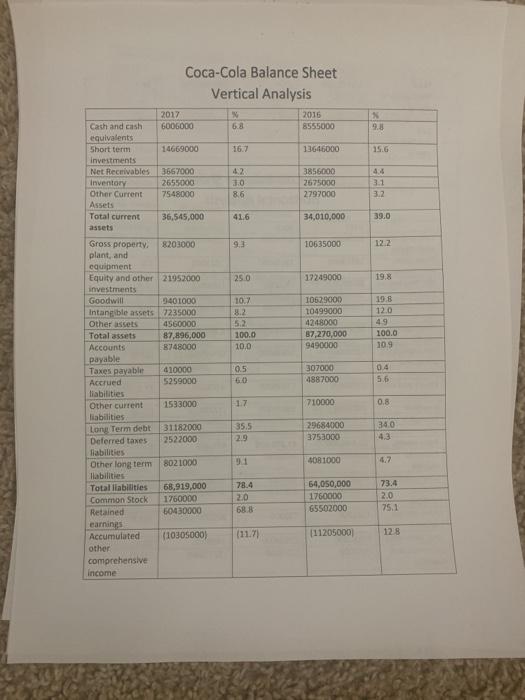
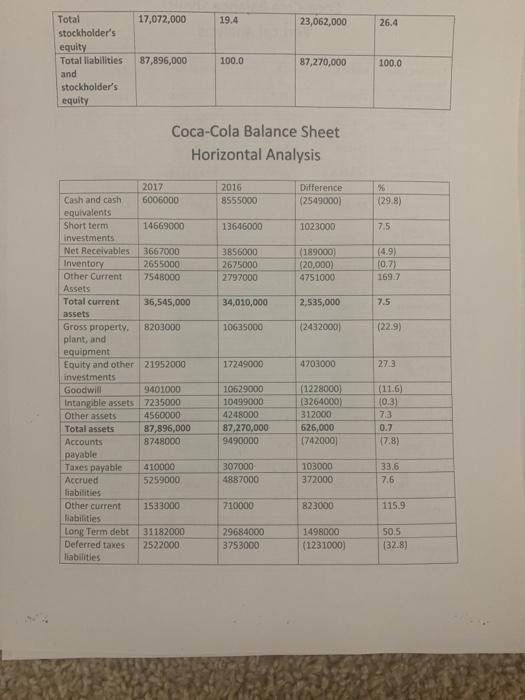
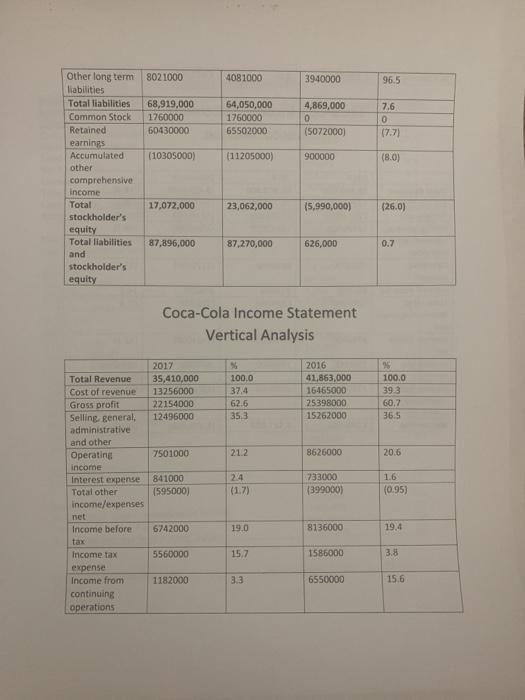
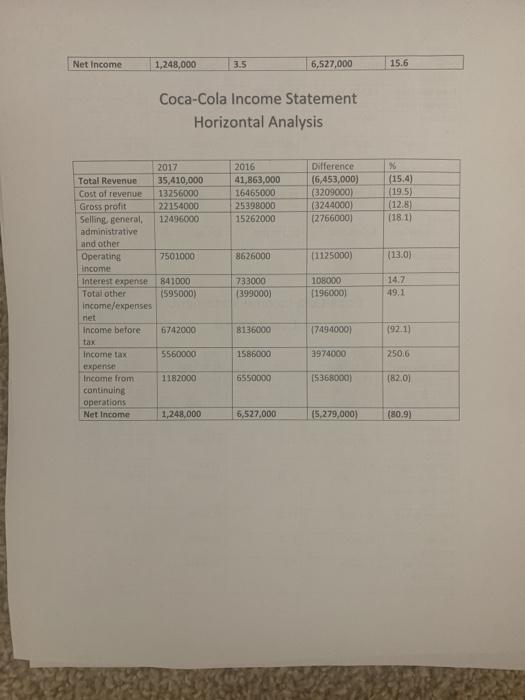
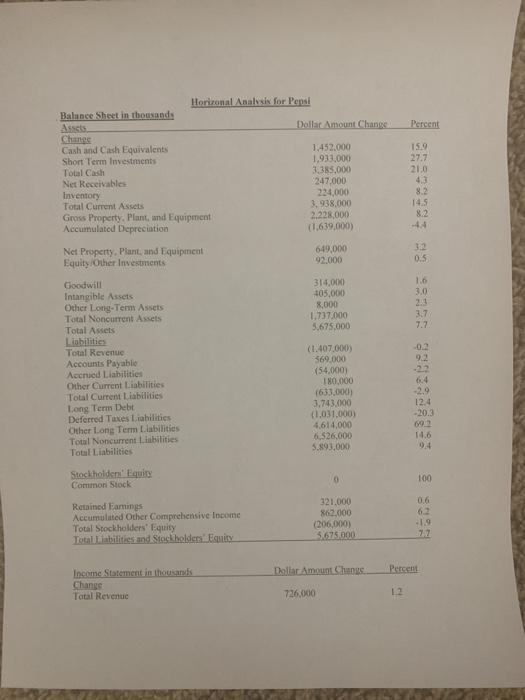
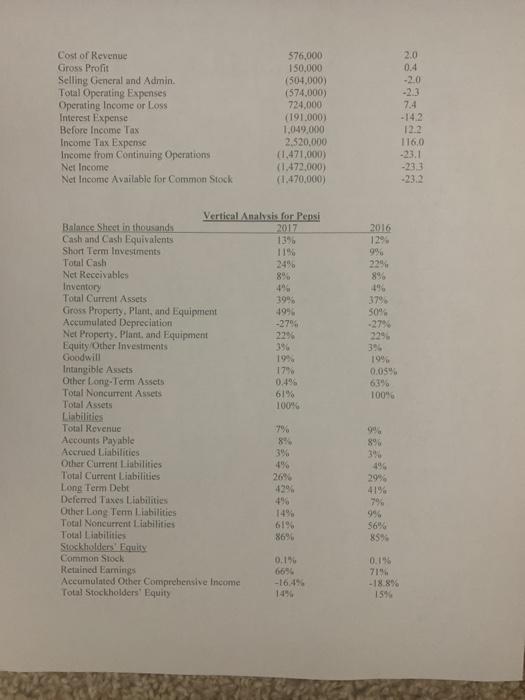
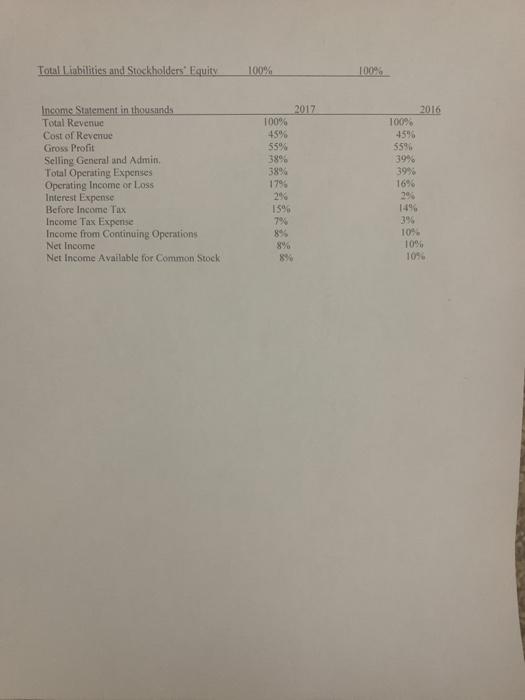
Create a vertical (same-size) & horizontal analysis (change in dollars and percent of change) for Coca-Cola and Pepsi, for 2016 and 2017. Also, calculate the following ratios for Coca-Cola and Pepsi, for 2016 and 2017: current ratio & quick ratio accounts receivable turnover & days sales in receivables Inventory turnover & days in inventory gross profit margin ratio, profit margin & return on investment After completing all the necessary calculations and analyses, explain what that information tells us about the companies: 1. Write a comparison of each company's 2016's current & quick ratio to its 2017 ratios, and a comparison of Pepsi's current & quick ratio to Coca-Cola's. Which company seems to be more liquid? What are the advantages and disadvantages of liquidity? 2. Write a comparison of each company's 2016's accounts receivable turnover and days sales in receivables to its 2017 ratios, and a comparison of Pepsi's accounts receivable turnover and days sales in receivables to Coca- Cola's. Which of the two seems to be doing a better job with receivables? How does this collection process affect the overall success of the companies? 3. Write a comparison of each company's 2016's inventory turnover and days in inventory to its 2017 ratios, and a comparison of Pepsi's inventory turnover and days in inventory to Coca-Cola's. Calculate for both companies for 2016 and 2017. Write a paragraph comparing 2016 with 2017 and Coca-Cola with Pepsi using these two ratios to indicate how they manage their inventory. Which one of the two companies has a better approach to inventory management? Why? What are the problems that come with poor inventory management? 4. Indicate which company shows the best prospects for future profits and explain in detail why you think the ratios support your observation. 5. Write a summary comparison of each company's 2016's vertical analysis to its 2017 analysis, and a summary comparison of Pepsi's vertical analysis to Coca-Cola's. Explain why vertical analyses are beneficial. 6. Write a summary comparison of each company's 2016's horizontal analysis to its 2017 analysis, and a summary comparison of Pepsi's horizontal analysis to Coca-Cola's. What do the changes indicate about the companies improvement or lack thereof between 2016 and 20177 Explain why one company is better than the other. 7. Based on all of your calculations and observations described above, make a recommendation as to which company would be a better investment. Give the reasons for your conclusion. Coca-Cola Balance Sheet Vertical Analysis 2017 2016 Cash and cash 6006000 6.8 8555000 9.8 equivalents Short term 14669000 16.7 13646000 15.6 investments Net Receivables Inventory Other Current Assets Total current 3667000 4.2 3856000 4.4 2655000 3.0 2675000 3.1 7548000 8.6 2797000 3.2 36,545,000 41.6 34,010,000 39.0 assets Gross property, plant, and 8203000 9.3 10635000 12.2 equipment Equity and other 21952000 investments 25.0 17249000 19.8 Goodwill 9401000 10.7 10629000 19.8 Intangible assets 7235000 Other assets Total assets Accounts 8.2 10499000 12.0 4560000 52 4248000 49 100.0 87,896.000 8748000 100.0 87,270,000 10.0 9490000 10.9 payable Taxes payable 307000 4887000 0.4 5.6 410000 0.5 Accrued 5259000 6.0 liabilities Other current liabilities 1533000 17 710000 0.8 29684000 34.0 Long Term debt Deferred taxes 31182000 2522000 35.5 2.9 53000 :4.3 liabilities 4081000 4.7 Other long term llabilities 8021000 73.4 64,050,000 1760000 65502000 68,919,000 78.4 Total liabilities Common Stock 1760000 20 2.0 75.1 Retained 60430000 68.8 earnings Accumulated (11.7) (11205000) 12.8 (1030s000) other comprehensive Income Total 17,072,000 19.4 23,062,000 26.4 stockholder's equity Total liabilities 87,896,000 100.0 87,270,000 100.0 and stockholder's equity Coca-Cola Balance Sheet Horizontal Analysis 2017 6006000 2016 Difference Cash and cash 8555000 (2549000) (29.8) equivalents Short term 14669000 13646000 1023000 7.5 investments Net Receivables 3667000 3856000 (189000) (20,000) 4751000 (4.9) (0.7) 169.7 2655000 Inventory Other Current 2675000 7548000 2797000 Assets Total current 36,545,000 34,010,000 2,535,000 7.5 assets Gross property. 8203000 10635000 (2432000) (22.9) plant, and equipment Equity and other 21952000 investments Goodwill 17249000 4703000 27.3 (1228000) (3264000) (11.6) 10.3) 9401000 10629000 Intangible assets 7235000 Other assets 10499000 4560000 4248000 87,270,000 9490000 312000 7.3 Total assets 87,896,000 626,000 0.7 Accounts 8748000 (742000) (7.8) payable Taxes payable 103000 410000 5259000 307000 4887000 33.6 Accrued 372000 7.6 liabilities Other current 1533000 710000 823000 115.9 iabilities Long Term debt Deferred taxes liabilities 31182000 2522000 29684000 1498000 50.5 3753000 (1231000) (32.8) Other long term liabilities 8021000 4081000 3940000 96.5 Total liabilities 68,919,000 64,050,000 4,869,000 7.6 Common Stock 1760000 1760000 Retained 60430000 65502000 (5072000) (7.7) earnings Accumulated (10305000) (11205000) 900000 (8.0) other comprehensive income Total 17,072,000 23,062,000 (5,990,000) (26.0) stockholder's equity Total liabilities 87,896,000 87,270,000 626,000 0.7 and stockholder's equity Coca-Cola Income Statement Vertical Analysis 2017 2016 35,410,000 13256000 100.0 41.863,000 16465000 25398000 100.0 Total Revenue Cost of revenue 37.4 39.3 Gross profit 22154000 62.6 60,7 Selling. general, administrative 12496000 35.3 15262000 36.5 and other 7501000 21.2 8626000 20.6 Operating incorne Interest expense Total other income/expenses 733000 (399000) 841000 2.4 1.6 (595000) (1.7) (0.95) net Income before 6742000 19.0 8136000 19.4 tax Income tax 5560000 15,7 1586000 3.8 xpense Income from 1182000 3.3 6550000 15.6 continuing operations Net Income 1,248,000 3.5 6,527,000 15.6 Coca-Cola Income Statement Horizontal Analysis. 2017 2016 Dilference (6,453,000) (3209000) (3244000) (2766000) (15.4) (19.5) (12.8) (18.1) Total Revenue 35,410,000 13256000 41,863,000 16465000 Cost of revenue Gross profit Selling, general, administrative 22154000 25398000 12496000 15262000 and other Operating 7501000 8626000 (1125000) (13.0) income 14.7 Interest expense 841000 Total other income/expenses 733000 108000 (595000) (399000) (196000) 49.1 net Income before 6742000 8136000 (7494000) (92.1) tax Income tax 5560000 1586000 3974000 250.6 expense Income from continuing 1182000 6550000 (5368000) (82.0) operations Net Income 1,248,000 6,527,000 (5,279,000) (80.9) Horizonal Analvsis for Pepsi Balance Sheet in thousands Asssts Change Cash and Cash Equivalents Short Term Investments Total Cash Net Receivables Dollar Amount Change Percent 1,452.000 1,933,000 3,385,000 247,000 224,000 3, 938,000 2,228,000 (1.639,000) 15.9 27.7 21.0 4.3 8.2 Inventory Total Curent Assets 14.5 8.2 Gross Property. Plant, and Equipment Accumulated Depreciation 4.4 Net Property, Plant, and Equipment Equity/Other Investments 649,000 92.000 3.2 0.5 1.6 314,000 405,000 8,000 1,737,000 5,675,000 Goodwill 3.0 Intangible Assets Other Long-Tem Assets Total Noncurrent Assets 23 3.7 7.7 Total Assets Liabilities Total Revenue (1.407,000) 369.000 (54,000) 180,000 (633,000) 3,743,000 (1,031.000) 4.614,000 6,526,000 5.893,000 -0.2 9.2 Accounts Payable Accrued Liabilities Other Current Liabilities Total Current Liabilities Long Term Debt Deferred Taxes Liabilities Other Long Tem Liabilities Total Noncurrent Liabilities Total Liabilities -22 6.4 -2.9 12.4 -20.3 692 14.6 9.4 Stockholder Equity Common Stock 100 0.6 62 Retained Eamings Accumulated Other Comprehensive Income Total Stockholders' Equity Total Liabilities and Stackholders Equity 321,000 862,000 (206,000) 5.675.000 1.9 77 Dolar Amount Changs Percent Income Statement in thousands Change Total Revenue 726,000 12 Cost of Revenue Gross Profit 576,000 150,000 (504.000) 2.0 0.4 -2.0 Selling General and Admin. Total Operating Expenses Operating Income or Loss Interest Expense Before Income Tax -2.3 (574,000) 724,000 (191.000) 1,049,000 2,520,000 (1,471,000) (1.472,000) (1,470,000) 7.4 -14,2 12.2 Income Tax Expense Income from Continuing Operations Net Income Net Income Available for Common Stock 116,0 -23.1 -23.3 -23.2 Vertical Analysis for Pepsi 2017 13% 11% 24% 8% 4% 39% 49% -27% Balance Sheet in thousands Cash and Cash Equivalents Short Term Investments Total Cash 2016 12% 9% 22% 8% 4% 37% 50% -27% Net Receivables Inventory Total Current Assets Gross Property, Plant, and Equipment Accumulated Depreciation Net Property. Plant, and Equipment Equity Other Investments Goodwill Intangible Assets Other Long-Term Assets Total Noncurrent Assets Total Assets Liabilities Total Revenue Accounts Payable Accrued Liabilities Other Current Liabilities Total Current Liabilities Long Term Debt Deferred Taxes Liabilities Other Long Tenm Liabilities Total Noncurrent Liabilities Total Liabilities Stockholders Equity Common Stock Retained Earnings Accumulated Other Comprebensive Income Total Stockholders' Equity 22% 22% 3% 19% 17% 0.4% 61% 19% 0.05% 63% 100% 100% 7% 8% 3% 4% 26% 42% 4% 14% 61% 86% 3% 4% 29% 41% 7% 9% $6% 85% 0.1% 66% 0.1% 71% -16.4% -18.8% 14% 15% Total Liabilities and Stockholders' Equity 100% 100% ETT Income Statement in thousands Total Revenue Cost of Revenue Gross Profit Selling General and Admin. Total Operating Expenses Operating Income or Loss Interest Expense Before Income Tax Income Tax Expense Income from Continuing Operations 2017 100% 45% 55% 2016 100% 45% 55% 38% 38% 17% 2% 39% 39% 16% 2% 14% 3% 10% 10% 10% 15% 7% 8% Net Income Net Income Available for Common Stock 8% 8% Create a vertical (same-size) & horizontal analysis (change in dollars and percent of change) for Coca-Cola and Pepsi, for 2016 and 2017. Also, calculate the following ratios for Coca-Cola and Pepsi, for 2016 and 2017: current ratio & quick ratio accounts receivable turnover & days sales in receivables Inventory turnover & days in inventory gross profit margin ratio, profit margin & return on investment After completing all the necessary calculations and analyses, explain what that information tells us about the companies: 1. Write a comparison of each company's 2016's current & quick ratio to its 2017 ratios, and a comparison of Pepsi's current & quick ratio to Coca-Cola's. Which company seems to be more liquid? What are the advantages and disadvantages of liquidity? 2. Write a comparison of each company's 2016's accounts receivable turnover and days sales in receivables to its 2017 ratios, and a comparison of Pepsi's accounts receivable turnover and days sales in receivables to Coca- Cola's. Which of the two seems to be doing a better job with receivables? How does this collection process affect the overall success of the companies? 3. Write a comparison of each company's 2016's inventory turnover and days in inventory to its 2017 ratios, and a comparison of Pepsi's inventory turnover and days in inventory to Coca-Cola's. Calculate for both companies for 2016 and 2017. Write a paragraph comparing 2016 with 2017 and Coca-Cola with Pepsi using these two ratios to indicate how they manage their inventory. Which one of the two companies has a better approach to inventory management? Why? What are the problems that come with poor inventory management? 4. Indicate which company shows the best prospects for future profits and explain in detail why you think the ratios support your observation. 5. Write a summary comparison of each company's 2016's vertical analysis to its 2017 analysis, and a summary comparison of Pepsi's vertical analysis to Coca-Cola's. Explain why vertical analyses are beneficial. 6. Write a summary comparison of each company's 2016's horizontal analysis to its 2017 analysis, and a summary comparison of Pepsi's horizontal analysis to Coca-Cola's. What do the changes indicate about the companies improvement or lack thereof between 2016 and 20177 Explain why one company is better than the other. 7. Based on all of your calculations and observations described above, make a recommendation as to which company would be a better investment. Give the reasons for your conclusion. Coca-Cola Balance Sheet Vertical Analysis 2017 2016 Cash and cash 6006000 6.8 8555000 9.8 equivalents Short term 14669000 16.7 13646000 15.6 investments Net Receivables Inventory Other Current Assets Total current 3667000 4.2 3856000 4.4 2655000 3.0 2675000 3.1 7548000 8.6 2797000 3.2 36,545,000 41.6 34,010,000 39.0 assets Gross property, plant, and 8203000 9.3 10635000 12.2 equipment Equity and other 21952000 investments 25.0 17249000 19.8 Goodwill 9401000 10.7 10629000 19.8 Intangible assets 7235000 Other assets Total assets Accounts 8.2 10499000 12.0 4560000 52 4248000 49 100.0 87,896.000 8748000 100.0 87,270,000 10.0 9490000 10.9 payable Taxes payable 307000 4887000 0.4 5.6 410000 0.5 Accrued 5259000 6.0 liabilities Other current liabilities 1533000 17 710000 0.8 29684000 34.0 Long Term debt Deferred taxes 31182000 2522000 35.5 2.9 53000 :4.3 liabilities 4081000 4.7 Other long term llabilities 8021000 73.4 64,050,000 1760000 65502000 68,919,000 78.4 Total liabilities Common Stock 1760000 20 2.0 75.1 Retained 60430000 68.8 earnings Accumulated (11.7) (11205000) 12.8 (1030s000) other comprehensive Income Total 17,072,000 19.4 23,062,000 26.4 stockholder's equity Total liabilities 87,896,000 100.0 87,270,000 100.0 and stockholder's equity Coca-Cola Balance Sheet Horizontal Analysis 2017 6006000 2016 Difference Cash and cash 8555000 (2549000) (29.8) equivalents Short term 14669000 13646000 1023000 7.5 investments Net Receivables 3667000 3856000 (189000) (20,000) 4751000 (4.9) (0.7) 169.7 2655000 Inventory Other Current 2675000 7548000 2797000 Assets Total current 36,545,000 34,010,000 2,535,000 7.5 assets Gross property. 8203000 10635000 (2432000) (22.9) plant, and equipment Equity and other 21952000 investments Goodwill 17249000 4703000 27.3 (1228000) (3264000) (11.6) 10.3) 9401000 10629000 Intangible assets 7235000 Other assets 10499000 4560000 4248000 87,270,000 9490000 312000 7.3 Total assets 87,896,000 626,000 0.7 Accounts 8748000 (742000) (7.8) payable Taxes payable 103000 410000 5259000 307000 4887000 33.6 Accrued 372000 7.6 liabilities Other current 1533000 710000 823000 115.9 iabilities Long Term debt Deferred taxes liabilities 31182000 2522000 29684000 1498000 50.5 3753000 (1231000) (32.8) Other long term liabilities 8021000 4081000 3940000 96.5 Total liabilities 68,919,000 64,050,000 4,869,000 7.6 Common Stock 1760000 1760000 Retained 60430000 65502000 (5072000) (7.7) earnings Accumulated (10305000) (11205000) 900000 (8.0) other comprehensive income Total 17,072,000 23,062,000 (5,990,000) (26.0) stockholder's equity Total liabilities 87,896,000 87,270,000 626,000 0.7 and stockholder's equity Coca-Cola Income Statement Vertical Analysis 2017 2016 35,410,000 13256000 100.0 41.863,000 16465000 25398000 100.0 Total Revenue Cost of revenue 37.4 39.3 Gross profit 22154000 62.6 60,7 Selling. general, administrative 12496000 35.3 15262000 36.5 and other 7501000 21.2 8626000 20.6 Operating incorne Interest expense Total other income/expenses 733000 (399000) 841000 2.4 1.6 (595000) (1.7) (0.95) net Income before 6742000 19.0 8136000 19.4 tax Income tax 5560000 15,7 1586000 3.8 xpense Income from 1182000 3.3 6550000 15.6 continuing operations Net Income 1,248,000 3.5 6,527,000 15.6 Coca-Cola Income Statement Horizontal Analysis. 2017 2016 Dilference (6,453,000) (3209000) (3244000) (2766000) (15.4) (19.5) (12.8) (18.1) Total Revenue 35,410,000 13256000 41,863,000 16465000 Cost of revenue Gross profit Selling, general, administrative 22154000 25398000 12496000 15262000 and other Operating 7501000 8626000 (1125000) (13.0) income 14.7 Interest expense 841000 Total other income/expenses 733000 108000 (595000) (399000) (196000) 49.1 net Income before 6742000 8136000 (7494000) (92.1) tax Income tax 5560000 1586000 3974000 250.6 expense Income from continuing 1182000 6550000 (5368000) (82.0) operations Net Income 1,248,000 6,527,000 (5,279,000) (80.9) Horizonal Analvsis for Pepsi Balance Sheet in thousands Asssts Change Cash and Cash Equivalents Short Term Investments Total Cash Net Receivables Dollar Amount Change Percent 1,452.000 1,933,000 3,385,000 247,000 224,000 3, 938,000 2,228,000 (1.639,000) 15.9 27.7 21.0 4.3 8.2 Inventory Total Curent Assets 14.5 8.2 Gross Property. Plant, and Equipment Accumulated Depreciation 4.4 Net Property, Plant, and Equipment Equity/Other Investments 649,000 92.000 3.2 0.5 1.6 314,000 405,000 8,000 1,737,000 5,675,000 Goodwill 3.0 Intangible Assets Other Long-Tem Assets Total Noncurrent Assets 23 3.7 7.7 Total Assets Liabilities Total Revenue (1.407,000) 369.000 (54,000) 180,000 (633,000) 3,743,000 (1,031.000) 4.614,000 6,526,000 5.893,000 -0.2 9.2 Accounts Payable Accrued Liabilities Other Current Liabilities Total Current Liabilities Long Term Debt Deferred Taxes Liabilities Other Long Tem Liabilities Total Noncurrent Liabilities Total Liabilities -22 6.4 -2.9 12.4 -20.3 692 14.6 9.4 Stockholder Equity Common Stock 100 0.6 62 Retained Eamings Accumulated Other Comprehensive Income Total Stockholders' Equity Total Liabilities and Stackholders Equity 321,000 862,000 (206,000) 5.675.000 1.9 77 Dolar Amount Changs Percent Income Statement in thousands Change Total Revenue 726,000 12 Cost of Revenue Gross Profit 576,000 150,000 (504.000) 2.0 0.4 -2.0 Selling General and Admin. Total Operating Expenses Operating Income or Loss Interest Expense Before Income Tax -2.3 (574,000) 724,000 (191.000) 1,049,000 2,520,000 (1,471,000) (1.472,000) (1,470,000) 7.4 -14,2 12.2 Income Tax Expense Income from Continuing Operations Net Income Net Income Available for Common Stock 116,0 -23.1 -23.3 -23.2 Vertical Analysis for Pepsi 2017 13% 11% 24% 8% 4% 39% 49% -27% Balance Sheet in thousands Cash and Cash Equivalents Short Term Investments Total Cash 2016 12% 9% 22% 8% 4% 37% 50% -27% Net Receivables Inventory Total Current Assets Gross Property, Plant, and Equipment Accumulated Depreciation Net Property. Plant, and Equipment Equity Other Investments Goodwill Intangible Assets Other Long-Term Assets Total Noncurrent Assets Total Assets Liabilities Total Revenue Accounts Payable Accrued Liabilities Other Current Liabilities Total Current Liabilities Long Term Debt Deferred Taxes Liabilities Other Long Tenm Liabilities Total Noncurrent Liabilities Total Liabilities Stockholders Equity Common Stock Retained Earnings Accumulated Other Comprebensive Income Total Stockholders' Equity 22% 22% 3% 19% 17% 0.4% 61% 19% 0.05% 63% 100% 100% 7% 8% 3% 4% 26% 42% 4% 14% 61% 86% 3% 4% 29% 41% 7% 9% $6% 85% 0.1% 66% 0.1% 71% -16.4% -18.8% 14% 15% Total Liabilities and Stockholders' Equity 100% 100% ETT Income Statement in thousands Total Revenue Cost of Revenue Gross Profit Selling General and Admin. Total Operating Expenses Operating Income or Loss Interest Expense Before Income Tax Income Tax Expense Income from Continuing Operations 2017 100% 45% 55% 2016 100% 45% 55% 38% 38% 17% 2% 39% 39% 16% 2% 14% 3% 10% 10% 10% 15% 7% 8% Net Income Net Income Available for Common Stock 8% 8%
Step by Step Solution
There are 3 Steps involved in it

Get step-by-step solutions from verified subject matter experts