

Question: code in python Create an array called 'x_array that ranges from 0 to 100 and 10 included with a stop size of 0.25 and print
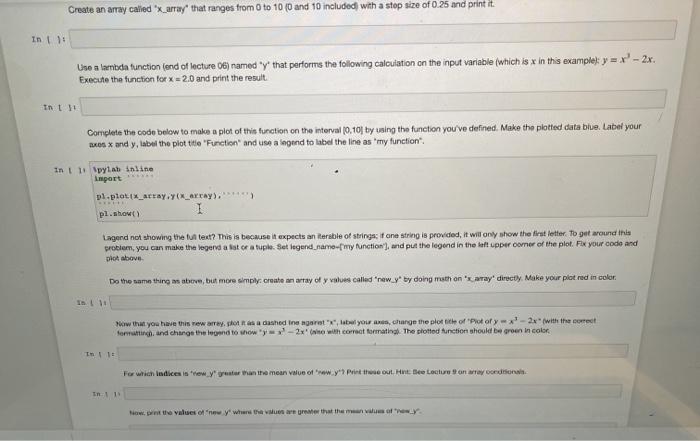
Create an array called 'x_array that ranges from 0 to 100 and 10 included with a stop size of 0.25 and print it in : Use a lambda function (end of lecture 06) named "y that performs the following calculation on the input variable (which is x in this example: y = x - 2x. Execute the function for 2.0 and print the result In Complete the code below to make a plot of this function on the interval |0.10 by using the function you've defined. Make the plotted data blue Label your xos x und y, label the plot title 'Function and use a ingend to label the line as my function In 1 pylab Inline Import pl.piotik_array. yox_array).**** pl.show 1 Lagend not showing the text? This is because it expects an erable of strings: if one string is provided, it will only show the first letter to get around this problem, you can make the legend a lot or a tuple Set legend_namomy function'), and put the legend in the left upper comer of the plot. Fix your code and blot above Do the same thing above, but more simply create an array of y values called 'new_y' by doing math on "saray'dirty. Make your pilot red in color Now that you have this new array of a dashed in garatx, label your change the plot site of Plot of y-2x*(with the correct forming and change the lead to show y-2x it with correct format. The plotted function should be groen in color For which indices you an the mean value of new.yProtese out. Hot tee toote on worden TR1 pret the value of new y' when there that the means of
Step by Step Solution
There are 3 Steps involved in it

Get step-by-step solutions from verified subject matter experts