

Question: Please help, language is python Create an array called x_array that ranges from 0 to 10 (0 and 10 included) with a step size of
![size of 0.25 and print it. In [ ]: Use a lambda](https://dsd5zvtm8ll6.cloudfront.net/si.experts.images/questions/2024/09/66f454c677097_51766f454c5e3f28.jpg)
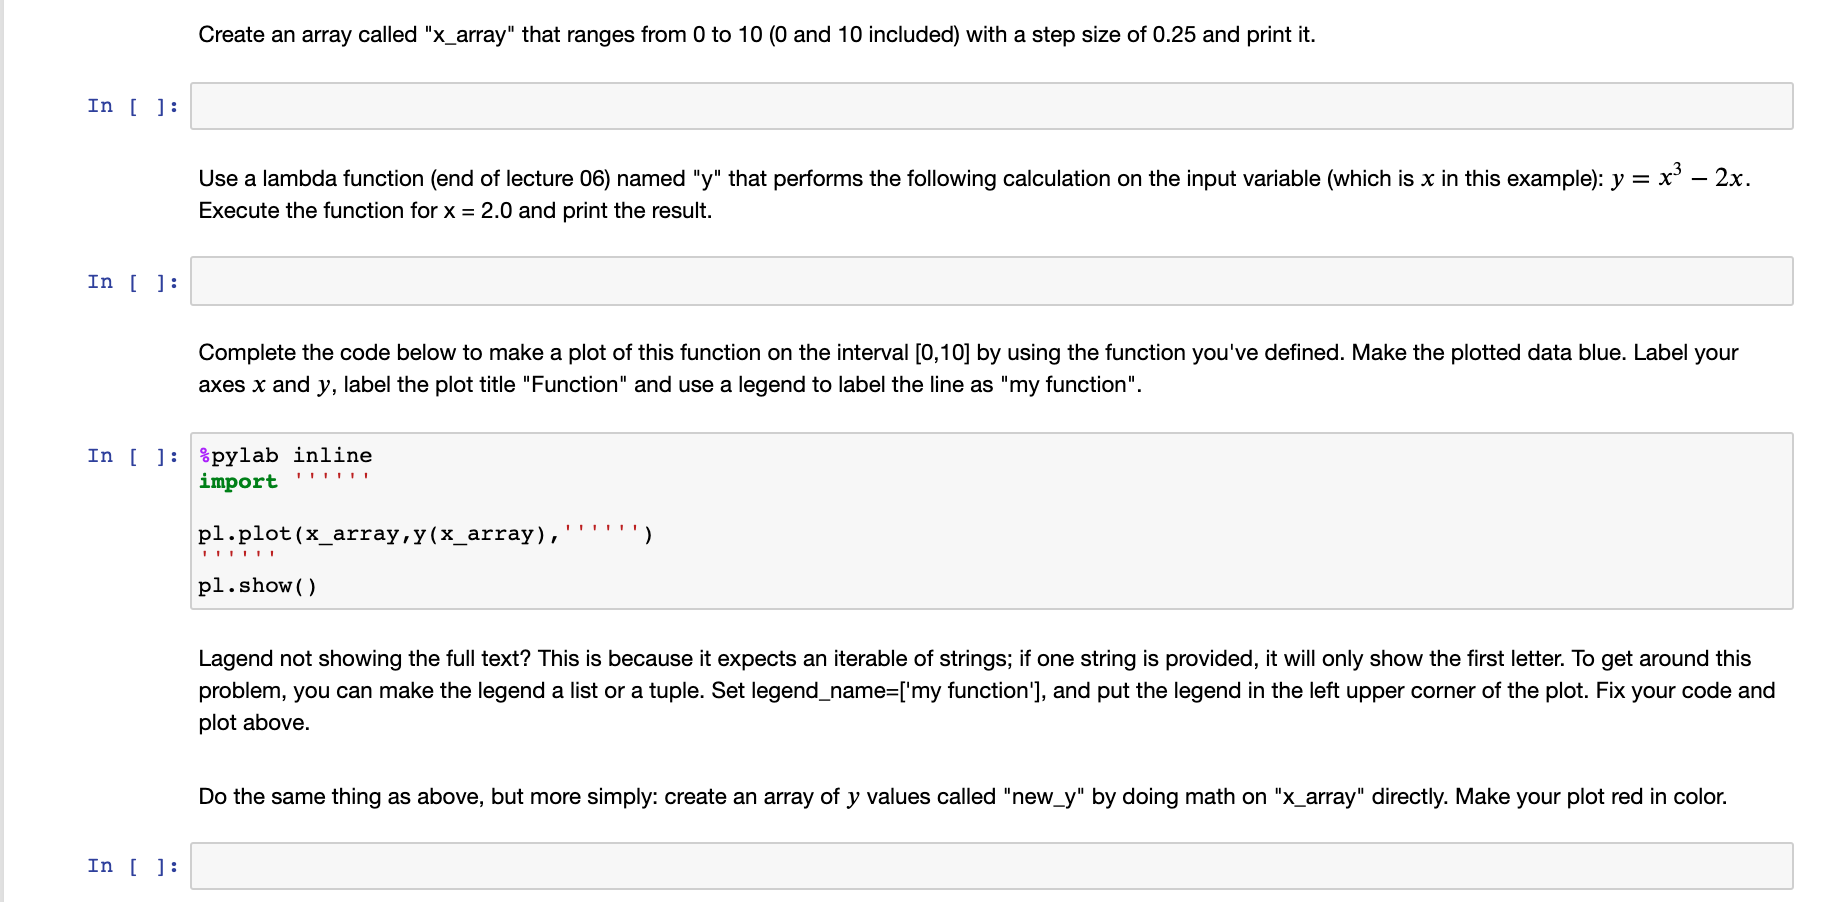
Please help, language is python
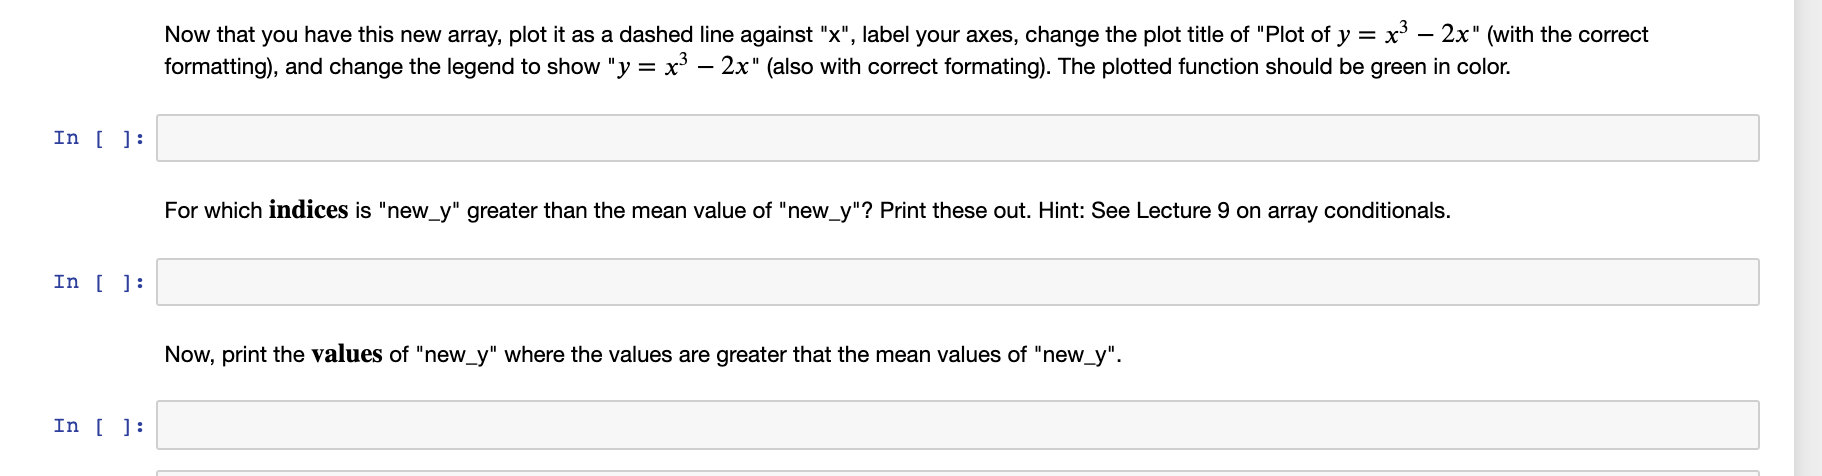
Create an array called "x_array" that ranges from 0 to 10 (0 and 10 included) with a step size of 0.25 and print it. In [ ]: Use a lambda function (end of lecture 06) named "y" that performs the following calculation on the input variable (which is x in this example): y = : x3 2x. Execute the function for x = 2.0 and print the result. In [ ]: Complete the code below to make a plot of this function on the interval [0,10] by using the function you've defined. Make the plotted data blue. Label your axes x and y, label the plot title "Function" and use a legend to label the line as "my function". In [ ]: Spylab inline import pl.plot(x_array, y(x_array), pl.show() Lagend not showing the full text? This is because it expects an iterable of strings; if one string is provided, it will only show the first letter. To get around this problem, you can make the legend a list or a tuple. Set legend_name=['my function'], and put the legend in the left upper corner of the plot. Fix your code and plot above. Do the same thing as above, but more simply: create an array of y values called "new_y" by doing math on "x_array" directly. Make your plot red in color. In [] : Now that you have this new array, plot it as a dashed line against "x", label your axes, change the plot title of "Plot of y = : x3 - 2x" (with the correct formatting), and change the legend to show "y = x3 2x" (also with correct formating). The plotted function should be green in color. In [ ]: For which indices is "new_y" greater than the mean value of "new_y"? Print these out. Hint: See Lecture 9 on array conditionals. In [ ]: Now, print the values of "new_y" where the values are greater that the mean values of "new_y". In [ ]: Now that you have this new array, plot it as a dashed line against "x", label your axes, change the plot title of "Plot of y = : x3 - 2x" (with the correct formatting), and change the legend to show "y = x3 2x" (also with correct formating). The plotted function should be green in color. In [ ]: For which indices is "new_y" greater than the mean value of "new_y"? Print these out. Hint: See Lecture 9 on array conditionals. In [ ]: Now, print the values of "new_y" where the values are greater that the mean values of "new_y". In [ ]
Step by Step Solution
There are 3 Steps involved in it

Get step-by-step solutions from verified subject matter experts