

Question: Code in python. Practice making plots using matplotlib. Use the following equation: B (1,T) 2hc2 = 15 (expl J-1) his Planck's constant, c is the
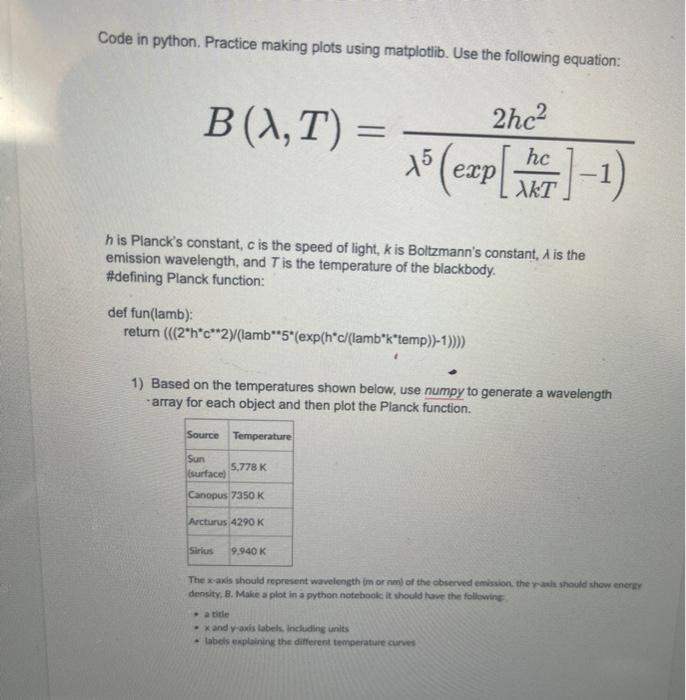
Code in python. Practice making plots using matplotlib. Use the following equation: B (1,T) 2hc2 = 15 (expl J-1) his Planck's constant, c is the speed of light, kis Boltzmann's constant, 1 is the emission wavelength, and Tis the temperature of the blackbody. #defining Planck function: def fun(lamb): return (((2**c**2)/(lamb**5* (exp(h*c/(lamb*k*temp))-1)))) 1) Based on the temperatures shown below, use numpy to generate a wavelength array for each object and then plot the Planck function. Source Temperature Sun 5.778 K surface Canopus 7350 K Arcturus 4290 K 9.940 K The x-axis should represent wavelength morm of the observed emission the should show energy density, B. Make a plot in a python notebook It should have the following - and yaxis labels, including units labels explaining the different temperature
Step by Step Solution
There are 3 Steps involved in it

Get step-by-step solutions from verified subject matter experts