

Question: code Problem 1 (10 points): MATLAB script-1 Create a m file (script file) that will generate a 2 x 2 subplot of the data given
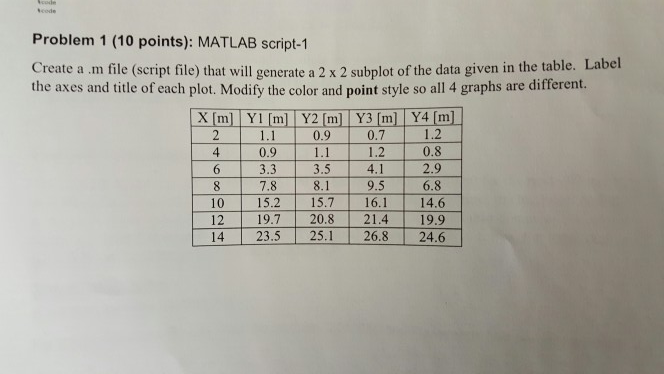
code Problem 1 (10 points): MATLAB script-1 Create a m file (script file) that will generate a 2 x 2 subplot of the data given in the table. Labe the axes and title of each plot. Modify the color and point style so all 4 graphs are different. 0.9 0.7 1.2 4 0.9 1.1 1.2 0.8 2.9 6.8 10 15.2 15.7 16.1 14.6 19.7 20.8 21.4 19.9 14 23.5 25.1 26.8 24.6 3.3 7.8 3.5 8.1 4.1 9.5 12
Step by Step Solution
There are 3 Steps involved in it
1 Expert Approved Answer
Step: 1 Unlock

Question Has Been Solved by an Expert!
Get step-by-step solutions from verified subject matter experts
Step: 2 Unlock
Step: 3 Unlock