

Question: please solve in matlab 1. The following table provides approximate values for a function f(x) at the shown values of x : Perform the following:
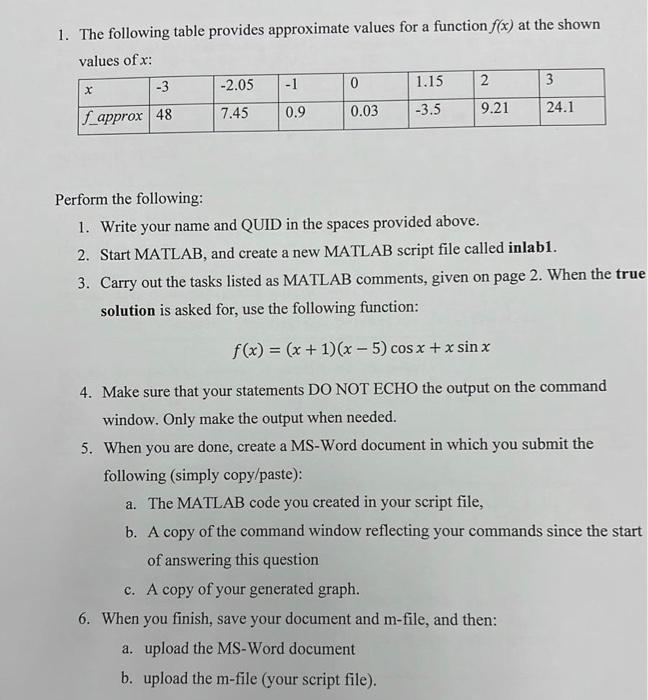
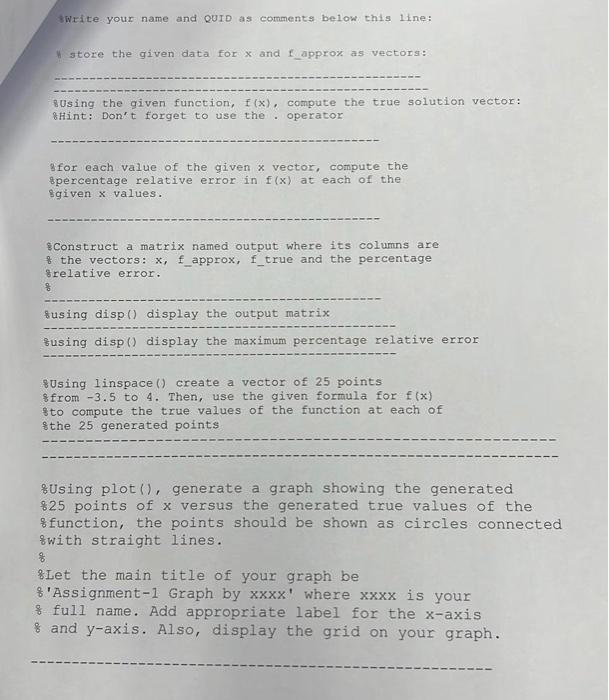
1. The following table provides approximate values for a function f(x) at the shown values of x : Perform the following: 1. Write your name and QUID in the spaces provided above. 2. Start MATLAB, and create a new MATLAB script file called inlab1. 3. Carry out the tasks listed as MATLAB comments, given on page 2 . When the true solution is asked for, use the following function: f(x)=(x+1)(x5)cosx+xsinx 4. Make sure that your statements DO NOT ECHO the output on the command window. Only make the output when needed. 5. When you are done, create a MS-Word document in which you submit the following (simply copy/paste): a. The MATLAB code you created in your script file, b. A copy of the command window reflecting your commands since the start of answering this question c. A copy of your generated graph. 6. When you finish, save your document and m-file, and then: a. upload the MS-Word document b. upload the m-file (your script file). Witite your name and QUID as comments below this 1 ine: 4 store the given data for x and f _approx as vectors: 8using the given function, f(x), compute the true solution vector: oHint: Don't forget to use the. operator 3for each value of the given x vector, compute the spercentage relative error in f(x) at each of the siven x values. \$onstruct a matrix named output where its columns are o the vectors: x,f fapprox, f.true and the percentage orelative error. 8) shusing disp() display the output matrix ousing disp() display the maximum percentage relative error 8 Using linspace () create a vector of 25 points sfrom 3.5 to 4 . Then, use the given formula for f(x) sto compute the true values of the function at each of othe 25 generated points \&Using plot(), generate a graph showing the generated 825 points of x versus the generated true values of the ofunction, the points should be shown as circles connected owith straight lines. 8 8Let the main title of your graph be of 'Assignment-1 Graph by xxxx' where xxx is your full name. Add appropriate label for the x-axis 8 and y-axis. Also, display the grid on your graph
Step by Step Solution
There are 3 Steps involved in it

Get step-by-step solutions from verified subject matter experts