

Question: % ################################################################################### % ## Code to be used after plot 4th fugure program ask user to input the mu value ## % ## try use
% ###################################################################################
% ## Code to be used after plot 4th fugure program ask user to input the mu value ##
% ## try use 0.01 for first Time to start estmated using function LMS ##
% ###################################################################################
clear all;
close all;
%% Part 1_A
N = 2000; %sampels
n = 0:N-1;
x=cos(0.03*pi*n);
figure(1);
stem(n,x);
xlabel('n');
ylabel('X[n]');
title('Part 1_A sequence of X[N] ');
%% ############################################################
% Part 1_B
C = [1, -2, 4]; %coefficient of unknown system(filter).
[F,w] = freqz(C,1,N);
figure(2);
%-------------------
subplot(2,1,1); %plot magnitude.
plot(w/pi,abs(F));
title('Magnitude');
%-------------------
subplot(2,1,2); %plot phase.
plot(w/pi,angle(F));
title('Phase');
%% ############################################################
% Part 1_C
spec = fft(x,N);
f = (0:N-1)/N;
figure(3);
stem(f,abs(spec));
xlabel('Normalized frequency (cycles/sample)');
ylabel('Amplitudde');
title('Spectrum of the input signal x[n]');
%% ############################################################
% Part 1_D
d = filter([1 -2 4],1,x); %find d(n).
figure(4);
subplot(2,1,1); %plot magnitude of d(n)
plot(n,abs(d));
title('Magnitude d(n)');
ylabel('Amplitude');
xlabel('n');
subplot(2,1,2); %plot phase of d(n)
plot(n,angle(d));
title('Phase d(n)');
ylabel('Amplitude');
xlabel('n');
%_______________________
L = 10; %read mu from user input.
S = sprintf('Enter the step -size factor mu (0 - %0.2f ): ',L);
mu = input(S);
%_______________________
%mu = 0.01; %can be changed as you want
w = zeros(1,4);
e = zeros(1,N);
J = zeros(1,N);
size = 4;
for n = size:length(x)
xn = x(n:-1:n-size+1);
y = xn * w.' ;
e(n) = d(n) - y;
w = w + 2* mu * e(n) * x(n:-1:n-size+1);
J(n) = e(n)^2;
end
%____________________________________________
% Plot the learning curves
% Plot the errror e(n).
figure(5);
plot(e);
title('Error vs Iteration Steps');
xlabel('Iteration Steps');
ylabel('Error');
%____________________________________________
% Plot (J vs iteration steps).
figure(6);
plot(J);
title('J vs Iteration Steps');
xlabel('Iteration Steps');
ylabel('J');
%____________________________________________
% Plot (10log10(J) vs iteration steps).
figure(7);
plot(10*log10(J));
title('10log10(J) vs Iteration Steps');
xlabel('Iteration Steps');
ylabel('10log10(J)');
%% ############################################################
% Part 1_E
%z = freqz(w,1);
[Z,s] = freqz(w,1,N);
figure(8);
subplot(2,1,1);
plot(abs(Z));
title('Magnitude Estimated FIR');
subplot(2,1,2);
plot(angle(Z));
title('Phase Estimated FIR');
%% ############################################################
% Part 1_F
% Repeat run code and change mu input from user
%% ############################################################
% Part 1_G
For this project i do the code which show in part B the filter if it high pass or low pass and so on
also in part E i plot the estimation
the good work is that must part B plot same as Part E plot Filter same but my code show real high pass but estimation part low pass is there problem in my code can u help me to find where is the error and solve it plz
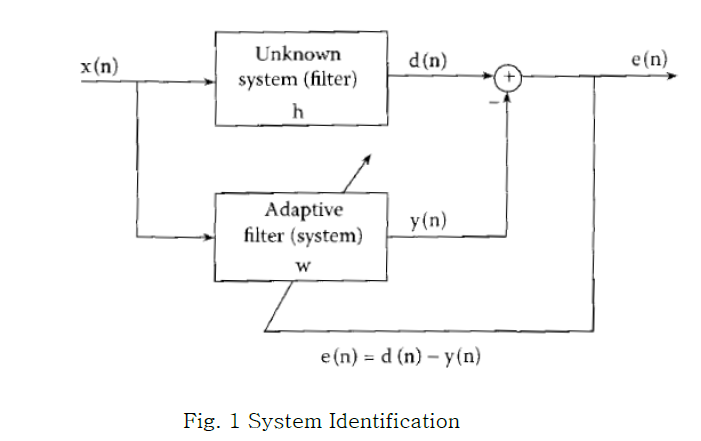
Fig. 1 System Identification
Step by Step Solution
There are 3 Steps involved in it

Get step-by-step solutions from verified subject matter experts