

Question: coding using matlab Homework Questions - Use MATLAB Live Seript (.mlx) files for the following. TOTAL 100 points 1. Plot the following functions on the
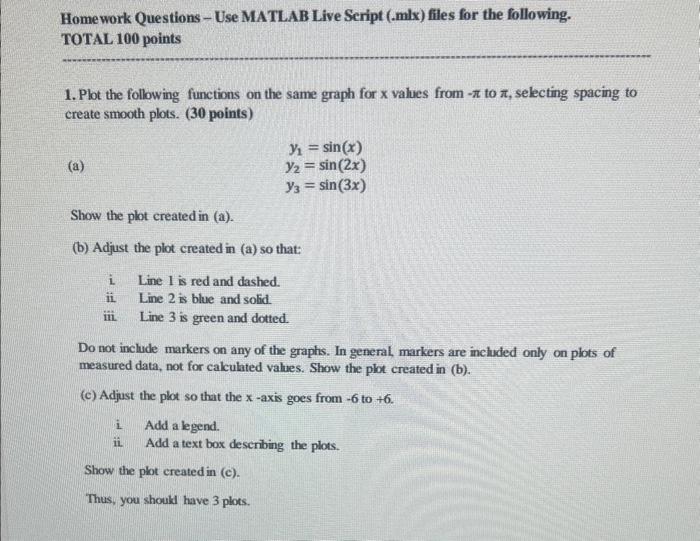
Homework Questions - Use MATLAB Live Seript (.mlx) files for the following. TOTAL 100 points 1. Plot the following functions on the same graph for x values from to , selecting spacing to create smooth plots. ( 30 points) (a) y1=sin(x)y2=sin(2x)y3=sin(3x) Show the plot created in (a). (b) Adjust the plot created in (a) so that: i. Line 1 is red and dashed. ii. Line 2 is blue and solid. iii. Line 3 is green and dotted. Do not include markers on any of the graphs. In general, markers are included only on plots of measured data, not for calculated values. Show the plot created in (b). (c) Adjust the plot so that the x-axis goes from 6 to +6. i. Add a legend. ii. Add a text box deseribing the plots. Show the plot created in (c). Thus, you should have 3 plots
Step by Step Solution
There are 3 Steps involved in it

Get step-by-step solutions from verified subject matter experts