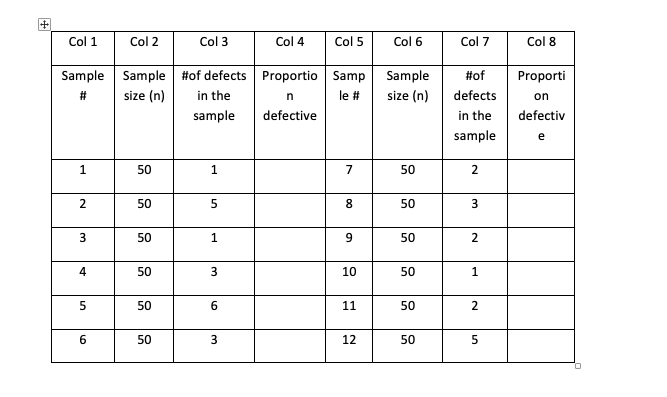
Question: Col 1 Col 2 Col3 Col 4 Col 5 Col 6 Col 7 Col 8 Sample Samp #of Proporti Sample size (n) #of defects Proportio

Col 1 Col 2 Col3 Col 4 Col 5 Col 6 Col 7 Col 8

Col 1 Col 2 Col3 Col 4 Col 5 Col 6 Col 7 Col 8Col 1 Col 2 Col3 Col 4 Col 5 Col 6 Col 7 Col 8

Col 1 Col 2 Col3 Col 4 Col 5 Col 6 Col 7 Col 8 Sample Samp #of Proporti Sample size (n) #of defects Proportio in the sample defective Sample size (n) on defects in the sample defectiv (a) Fill-in Proportion defective (Columns 4 and 8). Determine the UCL and LCL for the p chart with 95 percent confidence level.(1.96 standard errors). Standard Error = UCL = Center line = LCL = (b) What comments can you make about the process? (Does it seem to be under control?) Explain your answer by plotting a control chart. Label important points on the graph. TTTTTTT

Step by Step Solution

There are 3 Steps involved in it

1 Expert Approved Answer
Step: 1 Unlock blur-text-image
Question Has Been Solved by an Expert!

Get step-by-step solutions from verified subject matter experts

Step: 2 Unlock
Step: 3 Unlock

Students Have Also Explored These Related General Management Questions!