

Question: Column 1 denotes the mean course rating, and Column 2 denotes the mean professor rating. Using your preferred technology format (StatCrunch, Statdisk, Excel), generate a
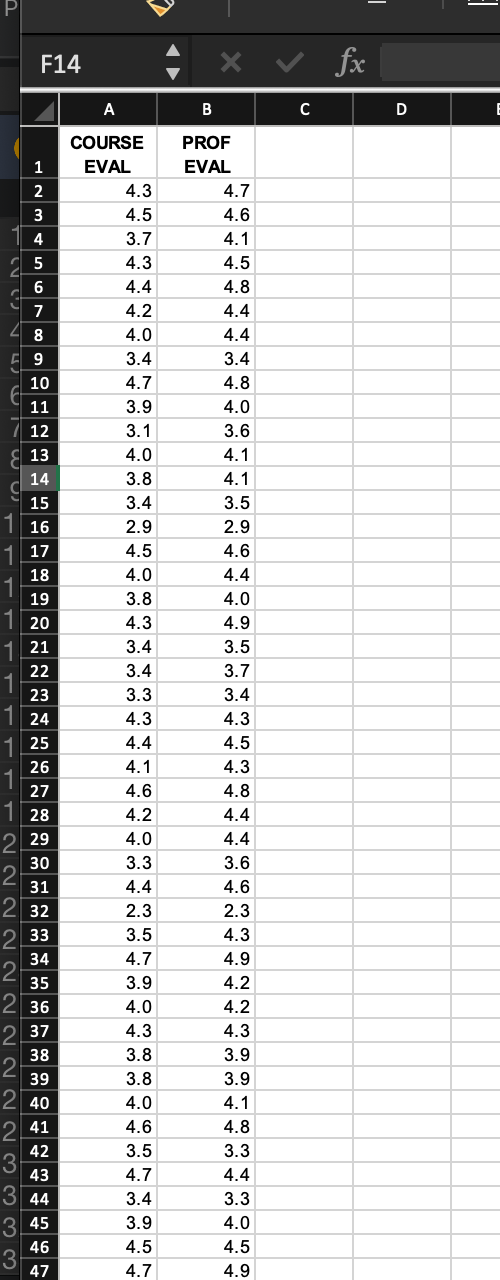
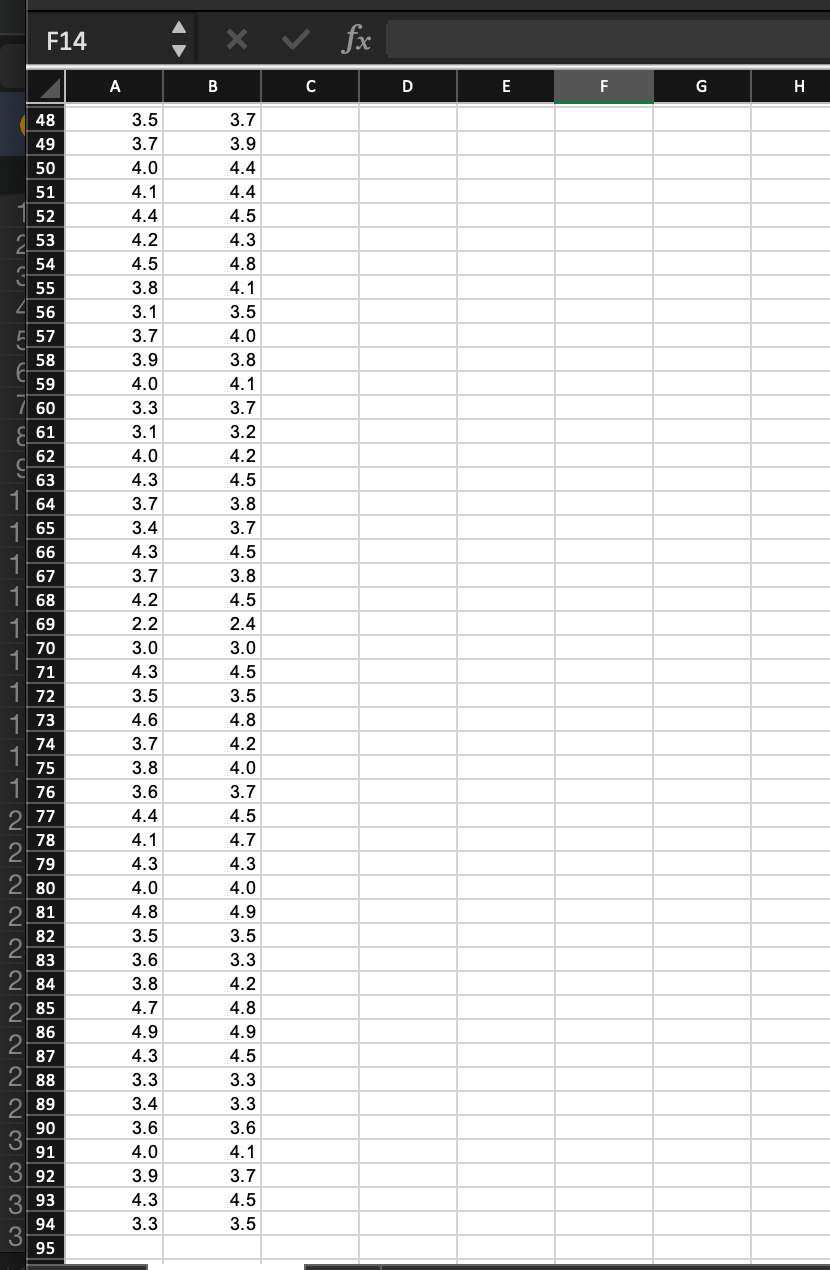
Column 1 denotes the mean course rating, and Column 2 denotes the mean professor rating. Using your preferred technology format (StatCrunch, Statdisk, Excel), generate a scatterplot for these two data sets. Based on the graph, do you believe the two sets are correlated?
Now, using the same program, complete a hypothesis test to test the claim that the course rating and the professor rating are correlated. Provide a printout of your technology output using the Insert/Edit Image feature (no attachments!) Explain your conclusion in statistical and non-statistical terms and how you arrived at that conclusion. Be sure to follow the 8-step procedure on page 360, using technology to do your calculations. You should include your null and alternative hypothesis (in English and in symbolic form), your significance level, whether you are conducting a right tailed, left tailed, or two tailed test, r-value, p-value, and conclusions.
F14 fx A B C D 1 2 3 4 5 6 7 8 9 10 11 12 13 14 15 16 17 18 19 20 21 22 23 24 25 COURSE EVAL 4.3 4.5 3.7 4.3 4.4 4.2 4.0 3.4 4.7 3.9 3.1 4.0 3.8 3.4 2.9 4.5 4.0 3.8 4.3 3.4 3.4 3.3 4.3 4.4 4.1 4.6 4.2 4.0 3.3 4.4 2.3 3.5 4.7 3.9 4.0 4.3 3.8 3.8 4.0 4.6 3.5 4.7 3.4 3.9 4.5 4.7 PROF EVAL 4.7 4.6 4.1 4.5 4.8 4.4 4.4 3.4 4.8 4.0 3.6 4.1 4.1 3.5 2.9 4.6 4.4 4.0 4.9 3.5 3.7 3.4 4.3 4.5 4.3 4.8 4.4 4.4 3.6 4.6 2.3 4.3 4.9 4.2 4.2 4.3 3.9 3.9 4.1 4.8 3.3 4.4 3.3 4.0 4.5 4.9 26 27 28 29 30 31 32 33 34 35 36 37 38 39 40 41 42 43 3 44 345 46 3 47 F14 fx I B D E F G H 48 49 50 51 52 53 54 55 56 57 58 59 60 61 62 63 64 65 66 67 68 69 70 71 3.5 3.7 4.0 4.1 4.4 4.2 4.5 3.8 3.1 3.7 3.9 4.0 3.3 3.1 4.0 4.3 3.7 3.4 4.3 3.7 4.2 2.2 3.0 4.3 3.5 4.6 3.7 3.8 3.6 4.4 4.1 4.3 4.0 4.8 3.5 3.6 3.8 4.7 4.9 4.3 3.3 3.4 3.6 4.0 3.9 4.3 3.3 3.7 3.9 4.4 4.4 4.5 4.3 4.8 4.1 3.5 4.0 3.8 4.1 3.7 3.2 4.2 4.5 3.8 3.7 4.5 3.8 4.5 2.4 3.0 4.5 3.5 4.8 4.2 4.0 3.7 4.5 4.7 4.3 4.0 4.9 3.5 3.3 4.2 4.8 4.9 4.5 3.3 3.3 3.6 4.1 3.7 4.5 3.5 72 73 74 75 76 77 78 79 2 80 2 81 82 2 83 2 84 2 85 86 2 87 2 88 2 89 90 3 91 3 92 3 93 94 3 95Step by Step Solution
There are 3 Steps involved in it

Get step-by-step solutions from verified subject matter experts