

Question: Column A contains 75 randomly generated integers. Use python to graph the distribution of numbers in the x and y axis. Choose your own
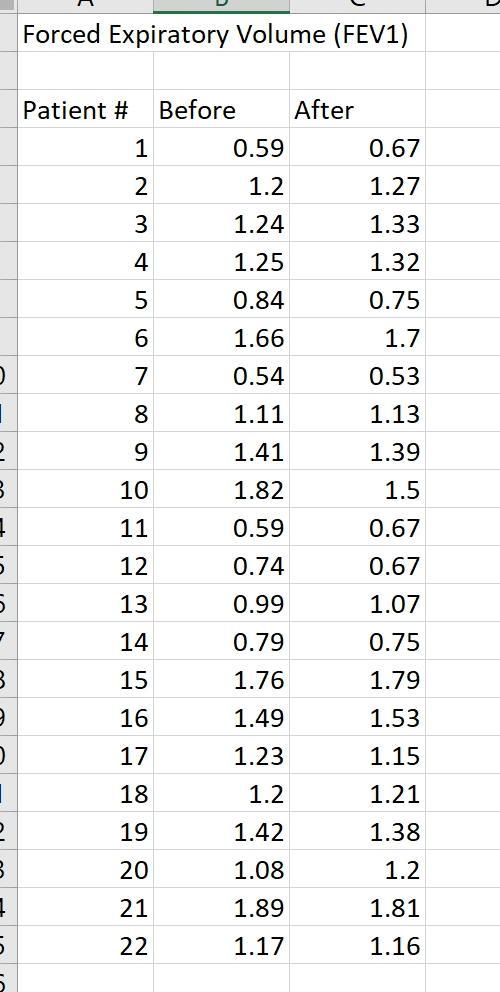
Column A contains 75 randomly generated integers. Use python to graph the distribution of numbers in the x and y axis. Choose your own styling, title, and labels. Then determine the following in your python script: a. Mean, median, and mode. Which is the most appropriate for this data set? b. Range, variance, standard deviation, standard error c. Is the data normal? Include the graph for determining normality. 3 3 3 5 5 Forced Expiratory Volume (FEV1) Patient # Before 1 2 3 4 5 6 7 8 9 10 11 12 13 14 15 16 17 18 19 20 21 22 0.59 1.2 1.24 1.25 0.84 1.66 0.54 1.11 1.41 1.82 0.59 0.74 0.99 0.79 1.76 1.49 1.23 1.2 1.42 1.08 1.89 1.17 After 0.67 1.27 1.33 1.32 0.75 1.7 0.53 1.13 1.39 1.5 0.67 0.67 1.07 0.75 1.79 1.53 1.15 1.21 1.38 1.2 1.81 1.16
Step by Step Solution
3.35 Rating (158 Votes )
There are 3 Steps involved in it
To graph the distribution of numbers in Column A and calculate the mean median mode range variance s... View full answer

Get step-by-step solutions from verified subject matter experts