

Question: Come up with the demand distribution (i.e., a distribution for the production time) using the historical data. Follow the steps below, and fill the
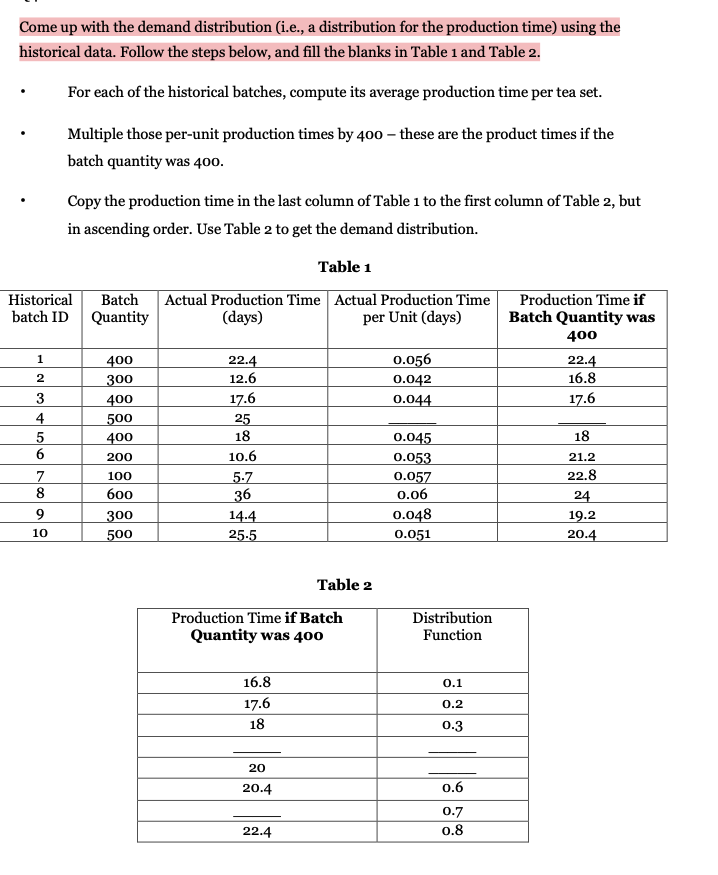
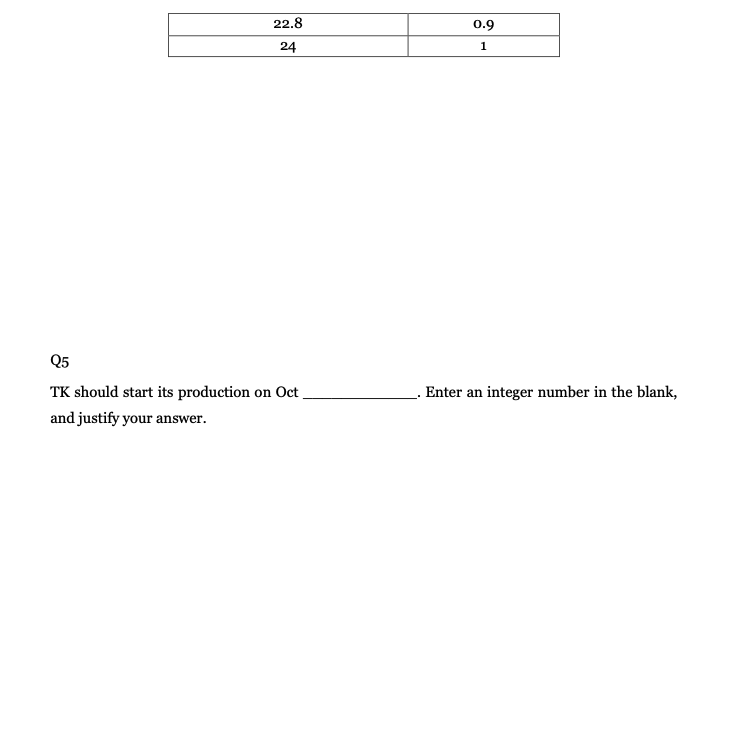
Come up with the demand distribution (i.e., a distribution for the production time) using the historical data. Follow the steps below, and fill the blanks in Table 1 and Table 2. For each of the historical batches, compute its average production time per tea set. Multiple those per-unit production times by 400 - these are the product times if the batch quantity was 400. Copy the production time in the last column of Table 1 to the first column of Table 2, but in ascending order. Use Table 2 to get the demand distribution. Table 1 Historical batch ID Batch Quantity Actual Production Time Actual Production Time (days) per Unit (days) Production Time if Batch Quantity was 400 1 400 22.4 0.056 22.4 2 300 12.6 0.042 16.8 3 400 17.6 0.044 17.6 4 500 25 5678 400 18 0.045 18 200 10.6 0.053 21.2 100 5.7 0.057 22.8 600 36 0.06 24 9 300 14.4 0.048 19.2 10 500 25.5 0.051 20.4 Table 2 Production Time if Batch Quantity was 400 Distribution Function 16.8 0.1 17.6 0.2 18 0.3 20 20.4 0.6 0.7 22.4 0.8 22.8 0.9 24 1 Q5 TK should start its production on Oct and justify your answer. Enter an integer number in the blank,
Step by Step Solution
3.27 Rating (162 Votes )
There are 3 Steps involved in it
To calculate the demand distribution we need to follow the steps provided and fill in the blanks in Table 1 and Table 2 Step 1 Compute the average production time per tea set for each historical batch ... View full answer

Get step-by-step solutions from verified subject matter experts