

Comet Dry Cleaners specializes in same-day dry cleaning. Customers drop off their garments early in the...
Fantastic news! We've Found the answer you've been seeking!
Question:
Transcribed Image Text:
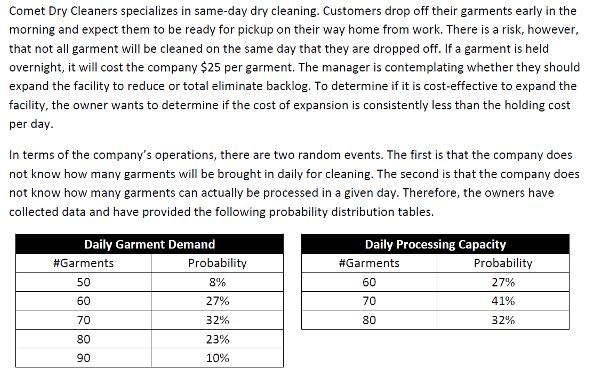
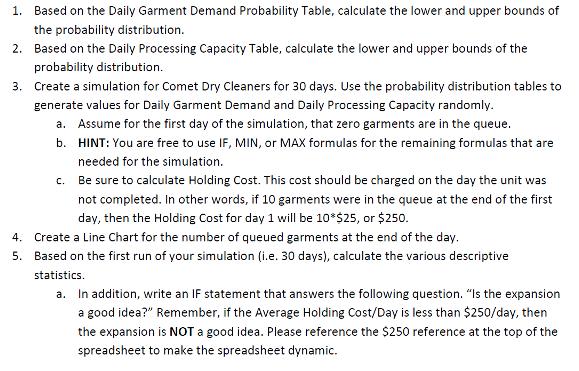
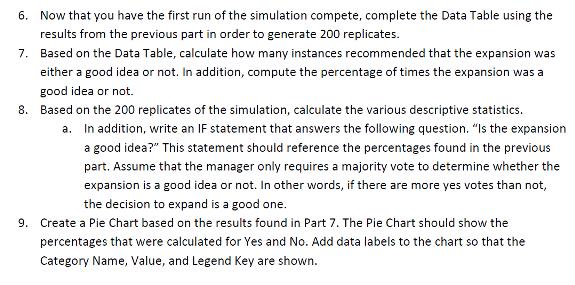
Comet Dry Cleaners specializes in same-day dry cleaning. Customers drop off their garments early in the morning and expect them to be ready for pickup on their way home from work. There is a risk, however, that not all garment will be cleaned on the same day that they are dropped off. If a garment is held overnight, it will cost the company $25 per garment. The manager is contemplating whether they should expand the facility to reduce or total eliminate backlog. To determine if it is cost-effective to expand the facility, the owner wants to determine if the cost of expansion is consistently less than the holding cost per day. In terms of the company's operations, there are two random events. The first is that the company does not know how many garments will be brought in daily for cleaning. The second is that the company does not know how many garments can actually be processed in a given day. Therefore, the owners have collected data and have provided the following probability distribution tables. Daily Garment Demand #Garments 50 60 70 80 90 Probability 8% 27% 32% 23% 10% Daily Processing Capacity #Garments 60 70 80 Probability 27% 41% 32% 1. Based on the Daily Garment Demand Probability Table, calculate the lower and upper bounds of the probability distribution. 2. Based on the Daily Processing Capacity Table, calculate the lower and upper bounds of the probability distribution. 3. Create a simulation for Comet Dry Cleaners for 30 days. Use the probability distribution tables to generate values for Daily Garment Demand and Daily Processing Capacity randomly. a. Assume for the first day of the simulation, that zero garments are in the queue. HINT: You are free to use IF, MIN, or MAX formulas for the remaining formulas that are needed for the simulation. b. c. Be sure to calculate Holding Cost. This cost should be charged on the day the unit was not completed. In other words, if 10 garments were in the queue at the end of the first day, then the Holding Cost for day 1 will be 10*$25, or $250. 4. Create a Line Chart for the number of queued garments at the end of the day. 5. Based on the first run of your simulation (i.e. 30 days), calculate the various descriptive statistics. a. In addition, write an IF statement that answers the following question. "Is the expansion a good idea?" Remember, if the Average Holding Cost/Day is less than $250/day, then the expansion is NOT a good idea. Please reference the $250 reference at the top of the spreadsheet to make the spreadsheet dynamic. 6. Now that you have the first run of the simulation compete, complete the Data Table using the results from the previous part in order to generate 200 replicates. 7. Based on the Data Table, calculate how many instances recommended that the expansion was either a good idea or not. In addition, compute the percentage of times the expansion was a good idea or not. 8. Based on the 200 replicates of the simulation, calculate the various descriptive statistics. a. In addition, write an IF statement that answers the following question. "Is the expansion a good idea?" This statement should reference the percentages found in the previous part. Assume that the manager only requires a majority vote to determine whether the expansion is a good idea or not. In other words, if there are more yes votes than not, the decision to expand is a good one. 9. Create a Pie Chart based on the results found in Part 7. The Pie Chart should show the percentages that were calculated for Yes and No. Add data labels to the chart so that the Category Name, Value, and Legend Key are shown. Comet Dry Cleaners specializes in same-day dry cleaning. Customers drop off their garments early in the morning and expect them to be ready for pickup on their way home from work. There is a risk, however, that not all garment will be cleaned on the same day that they are dropped off. If a garment is held overnight, it will cost the company $25 per garment. The manager is contemplating whether they should expand the facility to reduce or total eliminate backlog. To determine if it is cost-effective to expand the facility, the owner wants to determine if the cost of expansion is consistently less than the holding cost per day. In terms of the company's operations, there are two random events. The first is that the company does not know how many garments will be brought in daily for cleaning. The second is that the company does not know how many garments can actually be processed in a given day. Therefore, the owners have collected data and have provided the following probability distribution tables. Daily Garment Demand #Garments 50 60 70 80 90 Probability 8% 27% 32% 23% 10% Daily Processing Capacity #Garments 60 70 80 Probability 27% 41% 32% 1. Based on the Daily Garment Demand Probability Table, calculate the lower and upper bounds of the probability distribution. 2. Based on the Daily Processing Capacity Table, calculate the lower and upper bounds of the probability distribution. 3. Create a simulation for Comet Dry Cleaners for 30 days. Use the probability distribution tables to generate values for Daily Garment Demand and Daily Processing Capacity randomly. a. Assume for the first day of the simulation, that zero garments are in the queue. HINT: You are free to use IF, MIN, or MAX formulas for the remaining formulas that are needed for the simulation. b. c. Be sure to calculate Holding Cost. This cost should be charged on the day the unit was not completed. In other words, if 10 garments were in the queue at the end of the first day, then the Holding Cost for day 1 will be 10*$25, or $250. 4. Create a Line Chart for the number of queued garments at the end of the day. 5. Based on the first run of your simulation (i.e. 30 days), calculate the various descriptive statistics. a. In addition, write an IF statement that answers the following question. "Is the expansion a good idea?" Remember, if the Average Holding Cost/Day is less than $250/day, then the expansion is NOT a good idea. Please reference the $250 reference at the top of the spreadsheet to make the spreadsheet dynamic. 6. Now that you have the first run of the simulation compete, complete the Data Table using the results from the previous part in order to generate 200 replicates. 7. Based on the Data Table, calculate how many instances recommended that the expansion was either a good idea or not. In addition, compute the percentage of times the expansion was a good idea or not. 8. Based on the 200 replicates of the simulation, calculate the various descriptive statistics. a. In addition, write an IF statement that answers the following question. "Is the expansion a good idea?" This statement should reference the percentages found in the previous part. Assume that the manager only requires a majority vote to determine whether the expansion is a good idea or not. In other words, if there are more yes votes than not, the decision to expand is a good one. 9. Create a Pie Chart based on the results found in Part 7. The Pie Chart should show the percentages that were calculated for Yes and No. Add data labels to the chart so that the Category Name, Value, and Legend Key are shown. Comet Dry Cleaners specializes in same-day dry cleaning. Customers drop off their garments early in the morning and expect them to be ready for pickup on their way home from work. There is a risk, however, that not all garment will be cleaned on the same day that they are dropped off. If a garment is held overnight, it will cost the company $25 per garment. The manager is contemplating whether they should expand the facility to reduce or total eliminate backlog. To determine if it is cost-effective to expand the facility, the owner wants to determine if the cost of expansion is consistently less than the holding cost per day. In terms of the company's operations, there are two random events. The first is that the company does not know how many garments will be brought in daily for cleaning. The second is that the company does not know how many garments can actually be processed in a given day. Therefore, the owners have collected data and have provided the following probability distribution tables. Daily Garment Demand #Garments 50 60 70 80 90 Probability 8% 27% 32% 23% 10% Daily Processing Capacity #Garments 60 70 80 Probability 27% 41% 32% 1. Based on the Daily Garment Demand Probability Table, calculate the lower and upper bounds of the probability distribution. 2. Based on the Daily Processing Capacity Table, calculate the lower and upper bounds of the probability distribution. 3. Create a simulation for Comet Dry Cleaners for 30 days. Use the probability distribution tables to generate values for Daily Garment Demand and Daily Processing Capacity randomly. a. Assume for the first day of the simulation, that zero garments are in the queue. HINT: You are free to use IF, MIN, or MAX formulas for the remaining formulas that are needed for the simulation. b. c. Be sure to calculate Holding Cost. This cost should be charged on the day the unit was not completed. In other words, if 10 garments were in the queue at the end of the first day, then the Holding Cost for day 1 will be 10*$25, or $250. 4. Create a Line Chart for the number of queued garments at the end of the day. 5. Based on the first run of your simulation (i.e. 30 days), calculate the various descriptive statistics. a. In addition, write an IF statement that answers the following question. "Is the expansion a good idea?" Remember, if the Average Holding Cost/Day is less than $250/day, then the expansion is NOT a good idea. Please reference the $250 reference at the top of the spreadsheet to make the spreadsheet dynamic. 6. Now that you have the first run of the simulation compete, complete the Data Table using the results from the previous part in order to generate 200 replicates. 7. Based on the Data Table, calculate how many instances recommended that the expansion was either a good idea or not. In addition, compute the percentage of times the expansion was a good idea or not. 8. Based on the 200 replicates of the simulation, calculate the various descriptive statistics. a. In addition, write an IF statement that answers the following question. "Is the expansion a good idea?" This statement should reference the percentages found in the previous part. Assume that the manager only requires a majority vote to determine whether the expansion is a good idea or not. In other words, if there are more yes votes than not, the decision to expand is a good one. 9. Create a Pie Chart based on the results found in Part 7. The Pie Chart should show the percentages that were calculated for Yes and No. Add data labels to the chart so that the Category Name, Value, and Legend Key are shown. Comet Dry Cleaners specializes in same-day dry cleaning. Customers drop off their garments early in the morning and expect them to be ready for pickup on their way home from work. There is a risk, however, that not all garment will be cleaned on the same day that they are dropped off. If a garment is held overnight, it will cost the company $25 per garment. The manager is contemplating whether they should expand the facility to reduce or total eliminate backlog. To determine if it is cost-effective to expand the facility, the owner wants to determine if the cost of expansion is consistently less than the holding cost per day. In terms of the company's operations, there are two random events. The first is that the company does not know how many garments will be brought in daily for cleaning. The second is that the company does not know how many garments can actually be processed in a given day. Therefore, the owners have collected data and have provided the following probability distribution tables. Daily Garment Demand #Garments 50 60 70 80 90 Probability 8% 27% 32% 23% 10% Daily Processing Capacity #Garments 60 70 80 Probability 27% 41% 32% 1. Based on the Daily Garment Demand Probability Table, calculate the lower and upper bounds of the probability distribution. 2. Based on the Daily Processing Capacity Table, calculate the lower and upper bounds of the probability distribution. 3. Create a simulation for Comet Dry Cleaners for 30 days. Use the probability distribution tables to generate values for Daily Garment Demand and Daily Processing Capacity randomly. a. Assume for the first day of the simulation, that zero garments are in the queue. HINT: You are free to use IF, MIN, or MAX formulas for the remaining formulas that are needed for the simulation. b. c. Be sure to calculate Holding Cost. This cost should be charged on the day the unit was not completed. In other words, if 10 garments were in the queue at the end of the first day, then the Holding Cost for day 1 will be 10*$25, or $250. 4. Create a Line Chart for the number of queued garments at the end of the day. 5. Based on the first run of your simulation (i.e. 30 days), calculate the various descriptive statistics. a. In addition, write an IF statement that answers the following question. "Is the expansion a good idea?" Remember, if the Average Holding Cost/Day is less than $250/day, then the expansion is NOT a good idea. Please reference the $250 reference at the top of the spreadsheet to make the spreadsheet dynamic. 6. Now that you have the first run of the simulation compete, complete the Data Table using the results from the previous part in order to generate 200 replicates. 7. Based on the Data Table, calculate how many instances recommended that the expansion was either a good idea or not. In addition, compute the percentage of times the expansion was a good idea or not. 8. Based on the 200 replicates of the simulation, calculate the various descriptive statistics. a. In addition, write an IF statement that answers the following question. "Is the expansion a good idea?" This statement should reference the percentages found in the previous part. Assume that the manager only requires a majority vote to determine whether the expansion is a good idea or not. In other words, if there are more yes votes than not, the decision to expand is a good one. 9. Create a Pie Chart based on the results found in Part 7. The Pie Chart should show the percentages that were calculated for Yes and No. Add data labels to the chart so that the Category Name, Value, and Legend Key are shown.
Expert Answer:

Related Book For 

Operations management processes and supply chain
ISBN: 978-0136065760
9th edition
Authors: Lee J Krajewski, Larry P Ritzman, Manoj K Malhotra
Posted Date:
Students also viewed these electrical engineering questions
-
Comet Dry Cleaners specializes in same-day dry cleaning. Customers drop off their garments early in the morning and expect them to be ready for pickup on their way home from work. There is a risk,...
-
Comet Dry Cleaners specializes in same-day dry cleaning. Customers drop off their garments early in the morning and expect them to be ready for pickup on their way home from work. The risk is,...
-
Customers drop off their prescriptions either at the drive-through counter or at the front counter of the pharmacy. Customers can request that their prescriptions be filled immediately. In this case,...
-
Ethanol reacts with sodium and forms two products which are Options: 1) Sodium ethanoate and hydrogen 2) Sodium ethanoate and oxygen 3) Sodium ethoxide and hydrogen 4) Sodium ethoxide and oxygen
-
For the bookstore sales data in Exercise 1, the correlation of number of sales people and sales is 0.965. a) If the number of people working is 2 standard deviations above the mean, how many standard...
-
During the energy crisis of the 1970s, and again in the last 5 years, Congress bemoaned the "price gouging" and "windfall" profits of the major oil companies. In the 1970s Congress imposed an "excess...
-
How can you ensure that a pattern provides the correct solution for your problem?
-
Chow Publications Inc. is a publicly traded media company focused on products for the home chef market. The company publishes a monthly magazine that can be purchased at newsstands and is available...
-
What is CCS? Why is it necessary? Classify the methods of CCS & explain briefly. Discuss the merits & demerits of it.
-
Ben Conway, Ida Chan, and Clair Scott formed CCS Consulting this year by making capital contributions of $278,000, $314,000, and $208,000, respectively. They anticipate annual profit of $480,000 and...
-
4) Complete the blanks in the chart below. Use the space below the chart to work your calculations. b) Present Value 15,000 7,500 36,500 Years 15 9 20 Interest Rate 6% 8% 12% Future Value 200,000...
-
While as the primary on site auditor from a CPA firm auditing the regional restaurant chain for the first time. I observed two realities (a tease way to call attention to what I will type). First,...
-
Explain the Authentication List of employees and managers who work in the facility Employee login credentials to banking local area network Authorization Employees authorized to authenticate into the...
-
On March 1, Murray signed a contract to pay Anton $2000 plus interest at 8% on June 1, and $3000 plus interest at 8% on September 1. Anton sold the contract to Randy on May 1 at a price negotiated to...
-
Elderly on a fixed income 2. Renters who live in a rent controlled apartment 3. People who are paying on a loan with adjustable interest rates 4. Banks who are collecting on loans with adjustable...
-
Consider the internal medicine clinic. The APP, who works alone, has negotiated a base compensation increase from $115,000 to $125,000. For the clinic to breakeven, what must be the corresponding...
-
Completing the actually simulation that will provide the list of the sample number and the list of NPV's. Can you explain how to get the results of the Monte Carlo Simulation? 1 Purchase 2 Purchase...
-
The Dow Jones Industrial Average reached a high of $ 7801.63 on December 29, 1997. Recall from Example 18.4 that it reached a high of $ 1003 on November 14, 1972. The Consumer Price Index for...
-
At Dot Corn, a large retailer of popular books demand is constant at 32.000 books per year. The cost of placing an order to replenish stock is $10 and the annual cost of holding is $4 per book. Stock...
-
A manufacturer of textile dyes can use two different processing routings for a particular type of dye. Routing 1 uses drying press A, and routing 2 uses drying press B. Roth routings require the same...
-
The information in Table is available for a large fund raising project. a. Determine the critical path and the expected completion time of the project. b. Plot the total project cost, starting from...
-
Test the overall significance of a regression model and identify the components of this test from your computer output.
-
Identify the sample.
-
Based on the strategy, what type of sampling technique will be used to identify the sample? a. Why did you choose this type of technique?

Study smarter with the SolutionInn App