

Question: commen on the graphs capital structure ( what graph means) The following graphs show the historical development of the companies' (Adidas and Nike) capital structures.
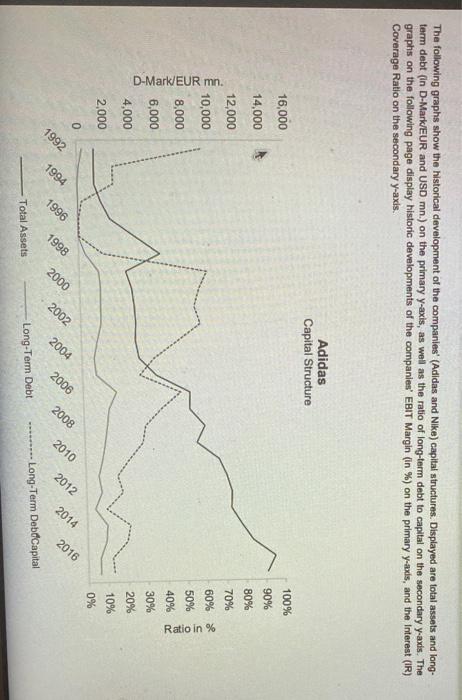
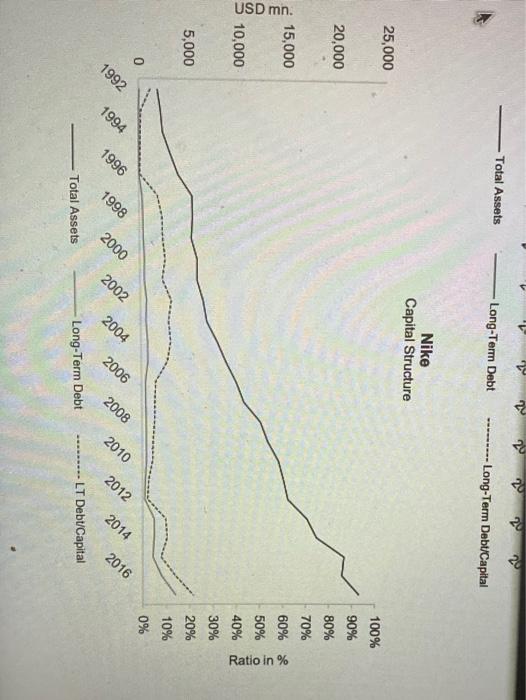
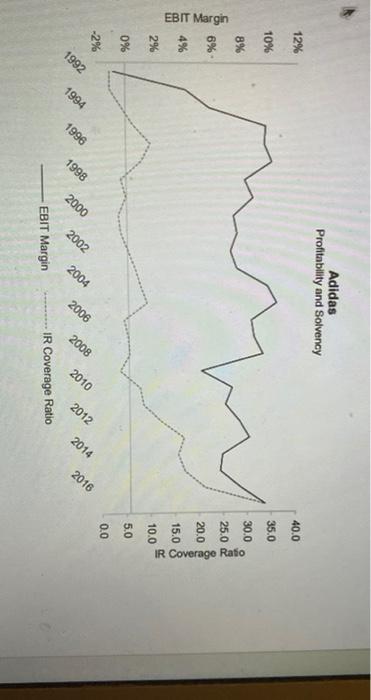
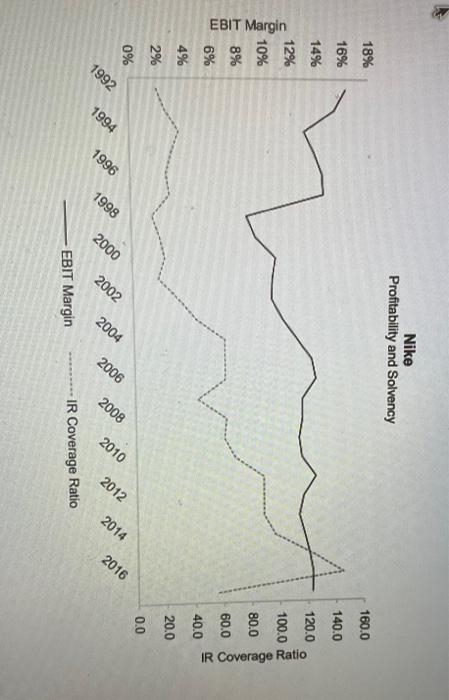
The following graphs show the historical development of the companies' (Adidas and Nike) capital structures. Displayed are total assets and long- term debt (in D-Mark/EUR and USD m.) on the primary y-axis, as well as the ratio of long-term debt to capital on the secondary y-axis. The graphs on the following page display historic developments of the companien' EBIT Margin (in %) on the primary y-axis, and the Interest (IR) Coverage Ratio on the secondary y-axis. Adidas Capital Structure 100% 16,000 14,000 90% 80% 12,000 70% 10,000 60% 50% D-Mark/EUR mn. Ratio in % 8,000 40% 6,000 30% 4,000 20% 10% 2,000 0% 0 2012 2010 1994 1996 2000 2002 2004 2006 2008 2014 2016 1992 1998 -------- Long-Term DebCapital Long-Term Debt Total Assets Total Assets - Long-Term Debt -------- Long-Term DebuCapital Nike Capital Structure 25,000 100% 90% 20,000 80% 70% 60% de 15,000 USD mn. 50% Ratio in % % 10,000 5,000 40% 30% 20% 10% 0% 1992 1994 2002 2014 2012 2010 1996 1998 2000 2004 2006 2008 2016 Total Assets Long-Term Debt LT Debt/Capital Adidas Profitability and Solvency 12% 40.0 10% 35.0 30.0 8% 25.0 6% %9 EBIT Margin 20.0 IR Coverage Ratio 15.08 2% 10.0 0% 5.0 0.0 -2% 2014 2012 1992 1994 1996 2004 2006 2008 2010 2016 1998 2000 2002 EBIT Margin IR Coverage Ratio Nike Profitability and Solvency 18% 160.0 16% 140.0 14% 120.0 12% 100.0 10% EBIT Margin 80.0 IR Coverage Ratio 8% 60.0 6% 40.0 4% 20.0 2% 0.0 0% 1992 1994 1996 1998 2000 2002 2004 2006 2008 2010 2012 2014 2016 EBIT Margin IR Coverage Ratio The following graphs show the historical development of the companies' (Adidas and Nike) capital structures. Displayed are total assets and long- term debt (in D-Mark/EUR and USD m.) on the primary y-axis, as well as the ratio of long-term debt to capital on the secondary y-axis. The graphs on the following page display historic developments of the companien' EBIT Margin (in %) on the primary y-axis, and the Interest (IR) Coverage Ratio on the secondary y-axis. Adidas Capital Structure 100% 16,000 14,000 90% 80% 12,000 70% 10,000 60% 50% D-Mark/EUR mn. Ratio in % 8,000 40% 6,000 30% 4,000 20% 10% 2,000 0% 0 2012 2010 1994 1996 2000 2002 2004 2006 2008 2014 2016 1992 1998 -------- Long-Term DebCapital Long-Term Debt Total Assets Total Assets - Long-Term Debt -------- Long-Term DebuCapital Nike Capital Structure 25,000 100% 90% 20,000 80% 70% 60% de 15,000 USD mn. 50% Ratio in % % 10,000 5,000 40% 30% 20% 10% 0% 1992 1994 2002 2014 2012 2010 1996 1998 2000 2004 2006 2008 2016 Total Assets Long-Term Debt LT Debt/Capital Adidas Profitability and Solvency 12% 40.0 10% 35.0 30.0 8% 25.0 6% %9 EBIT Margin 20.0 IR Coverage Ratio 15.08 2% 10.0 0% 5.0 0.0 -2% 2014 2012 1992 1994 1996 2004 2006 2008 2010 2016 1998 2000 2002 EBIT Margin IR Coverage Ratio Nike Profitability and Solvency 18% 160.0 16% 140.0 14% 120.0 12% 100.0 10% EBIT Margin 80.0 IR Coverage Ratio 8% 60.0 6% 40.0 4% 20.0 2% 0.0 0% 1992 1994 1996 1998 2000 2002 2004 2006 2008 2010 2012 2014 2016 EBIT Margin IR Coverage Ratio
Step by Step Solution
There are 3 Steps involved in it

Get step-by-step solutions from verified subject matter experts