

Question: Comment on each table/graph as they relate to the assumptions that are being tested (eg. describe if the image suggests the data is normally distributed
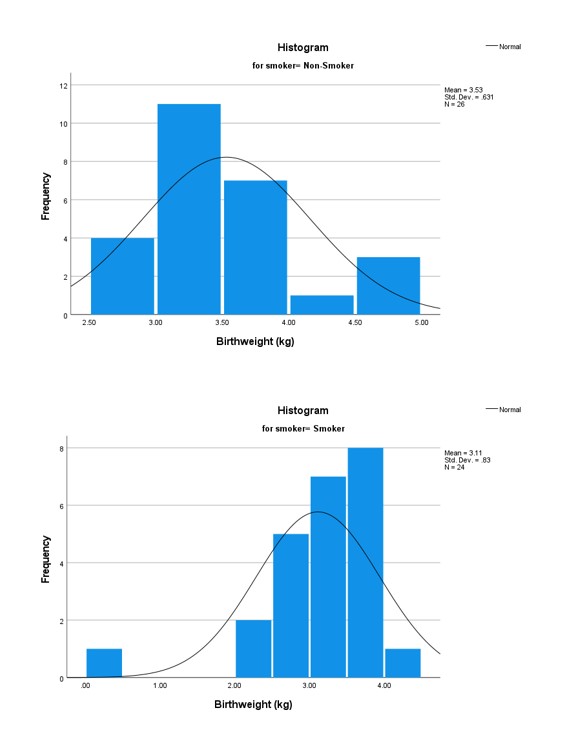
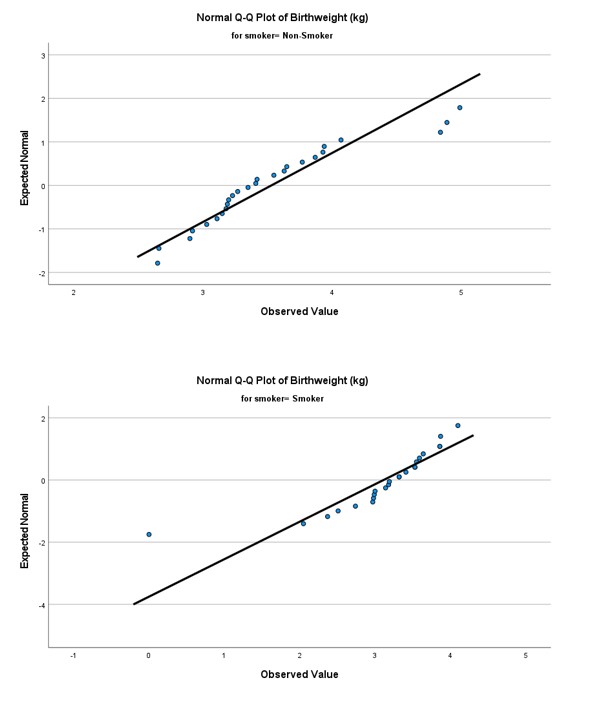
Comment on each table/graph as they relate to the assumptions that are being tested (eg. describe if the image suggests the data is normally distributed and why) and then come to a conclusion about whether the assumption of homogeneity of variance and the assumption of normality have each been met or violated overall.
*each of these 2 assumptions are independent of the other. one can be violated when the other is not violated, vice versa.
Hint* answer should also refer to what the null hypothesis is for each of the numerical tests, whether this null hypothesis is accepted or rejected, and state the pvalue used to draw this conclusion.
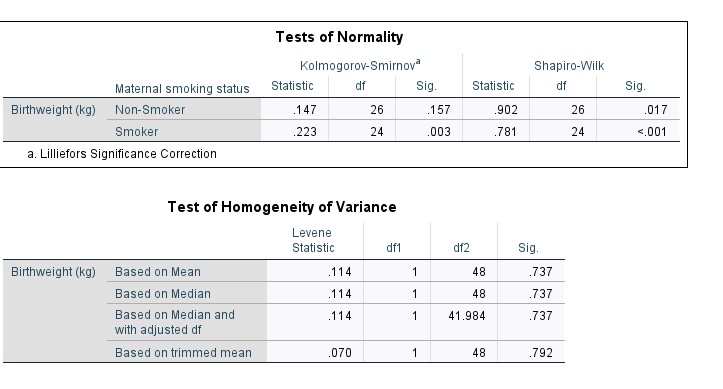
Tests of Normality Kolmogorov-Smirnov Shapiro-Wilk Maternal smoking status Statistic df Sig. Statistic df Sig. Birthweight (kg) Non-Smoker .147 26 157 902 26 017 Smoker 223 24 003 781 24 <.001 a. lilliefors significance correction test of homogeneity variance levene statistic df1 df2 sig. birthweight based on mean .737 median .114 and with adjusted df trimmed .792histogram normal for smoker="Non-Smoker" sad. dev.="631" n frequency histogram . n-m4 q-q plot expected .. ..... observed value>
Step by Step Solution
There are 3 Steps involved in it

Get step-by-step solutions from verified subject matter experts