

Question: Comment on each table/graph as they relate to the assumptions that are being tested (eg. describe if the image suggests the data is normally distributed

Comment on each table/graph as they relate to the assumptions that are being tested
(eg. describe if the image suggests the data is normally distributed and why) and then come to a conclusion about whether the assumption of homogeneity of variance and the assumption of normality have each been met or violated overall.
*each of these 2 assumptions are independent of the other. one can be violated when the other is not violated, vice versa.
Hint* answer should also refer to what the null hypothesis is for each of the numerical tests, whether this null hypothesis is accepted or rejected, and state the p value used to draw this conclusion.
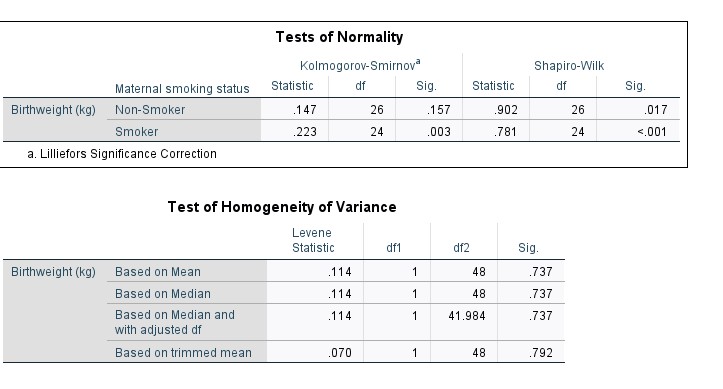
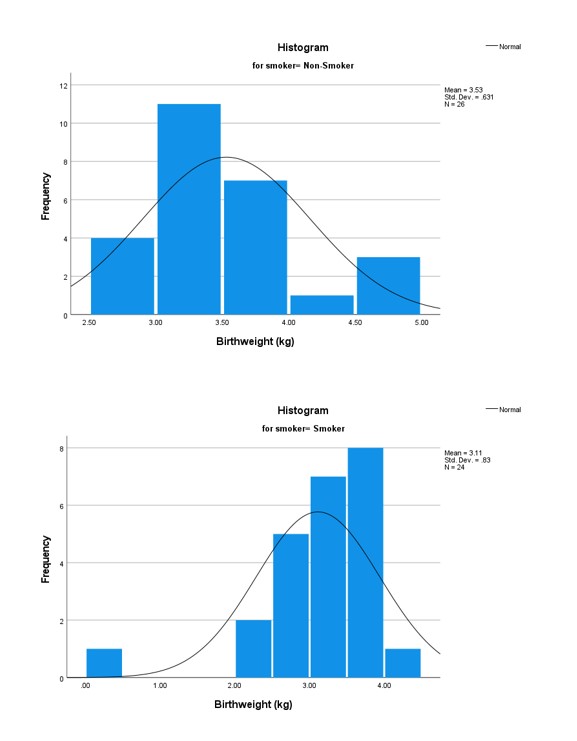
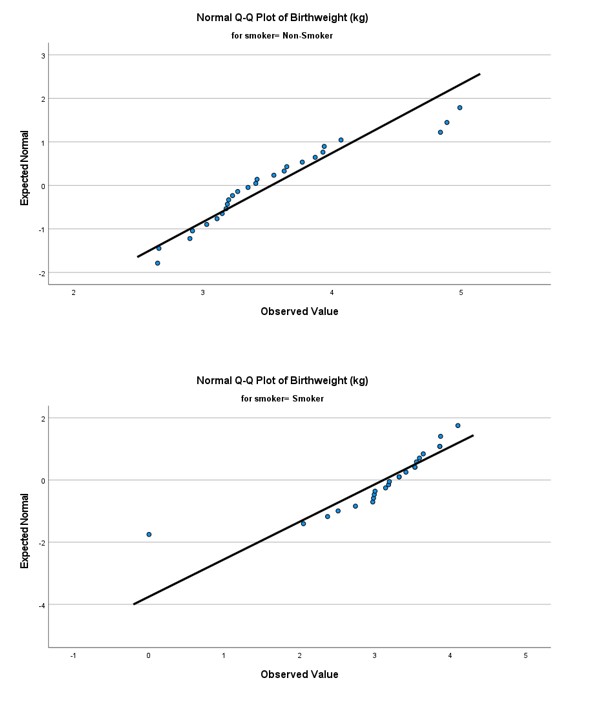
Tests of Normality Kolmogorov-Smirnov Shapiro-Wilk Maternal smoking status Statistic df Sig. Statistic df Sig. Birthweight (kg) Non-Smoker .147 26 157 902 26 017 Smoker 223 24 003 781 24 <.001 a. lilliefors significance correction test of homogeneity variance levene statistic df1 df2 sig. birthweight based on mean .737 median .114 and with adjusted df trimmed .792histogram normal for smoker="Non-Smoker" sad. dev.="631" n frequency histogram . n-m4 q-q plot expected .. ..... observed value>
Step by Step Solution
There are 3 Steps involved in it

Get step-by-step solutions from verified subject matter experts