

Question: comment on ehat you see in the chart Correlation of Residuals Vs BMI Residuals 35000 30000 25000 20000 15000 10000 5000 0 -50000 -10000 -
comment on ehat you see in the chart 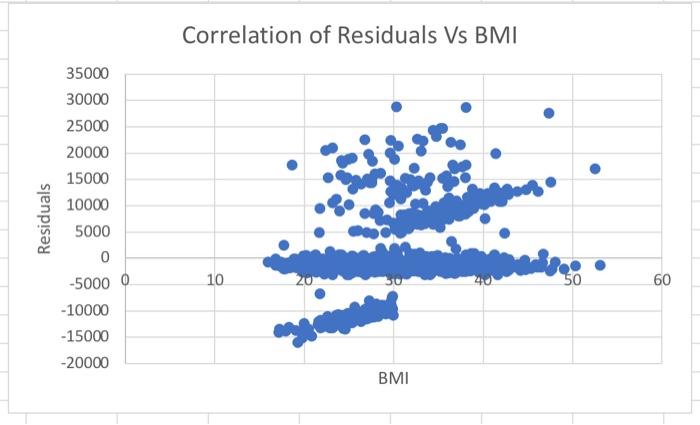
Correlation of Residuals Vs BMI Residuals 35000 30000 25000 20000 15000 10000 5000 0 -50000 -10000 - 15000 10 50 60 -20000 BMI
Step by Step Solution
There are 3 Steps involved in it
1 Expert Approved Answer
Step: 1 Unlock

Question Has Been Solved by an Expert!
Get step-by-step solutions from verified subject matter experts
Step: 2 Unlock
Step: 3 Unlock