

Question: Comment on the similarities and differences between your sample data and that of your classmates. Why are there differences if the samples are drawn from
Comment on the similarities and differences between your sample data and that of your classmates. Why are there differences if the samples are drawn from the same population?
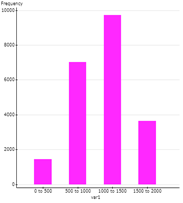
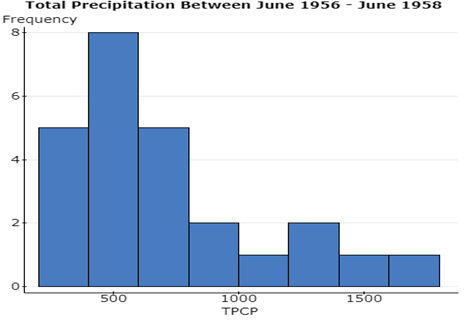
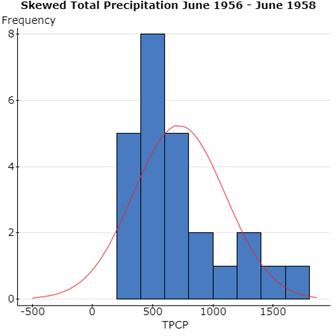
The Data I chose to determine the TPCP came from the NOAA for Manchester, NH. It reflects 25 months beginning in, June 1956-June 1958.Using Statcrunch, I was able to determine the mean, median and standard deviation. All values are in tenths of mm. The mean is 716.24; the median is 557; the standard deviation is 381.00626. Below is a copy of the histograms and Summary stats. I was unable to determine the interval for the middle 68%, as my data was skewed to the right. The empirical rule is used when a histogram or graph has a bell shape and is symmetric (Sullivan & Woodbury, 2016). I have attached a separate histogram on the right which illustrates that the bell curve is not symmetrical, as there isn't equal data on the left side.
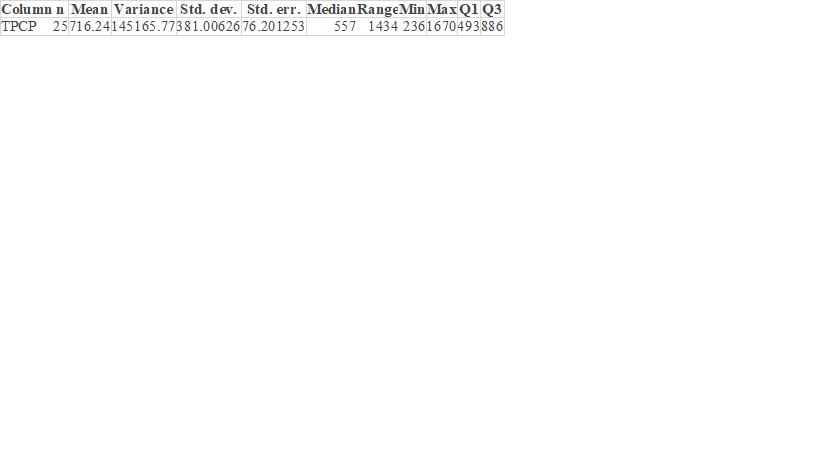
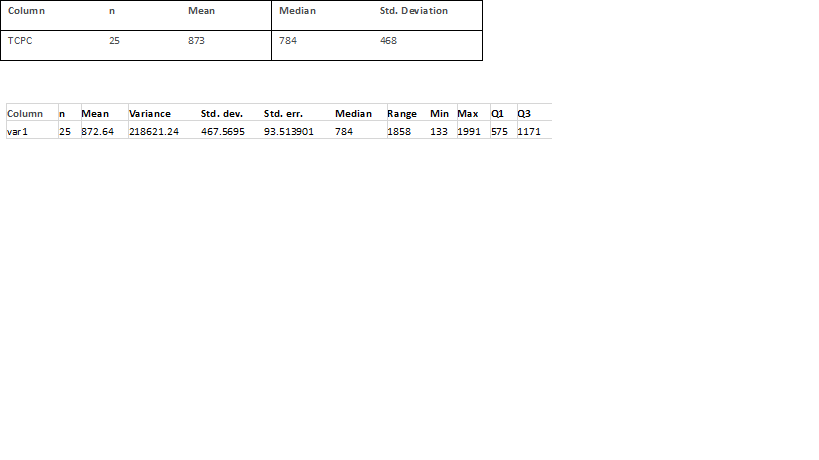
\f\f\f\fColumn n Mean Median Std. Deviation TCPC 25 873 784 468 Column n Mean Variance Std. dev. Std. err. Median Range Min Max Q1 03 var 1 25 872.64 218621.24 467.5695 93.513901 784 1858 133 1991 575 1171
Step by Step Solution
There are 3 Steps involved in it

Get step-by-step solutions from verified subject matter experts