Question: Comments Share v A O v 00 Insert Delete Format Conditional Format as Cell Formatting Table Styles Styles Sort & Find & Filter Select Analyze
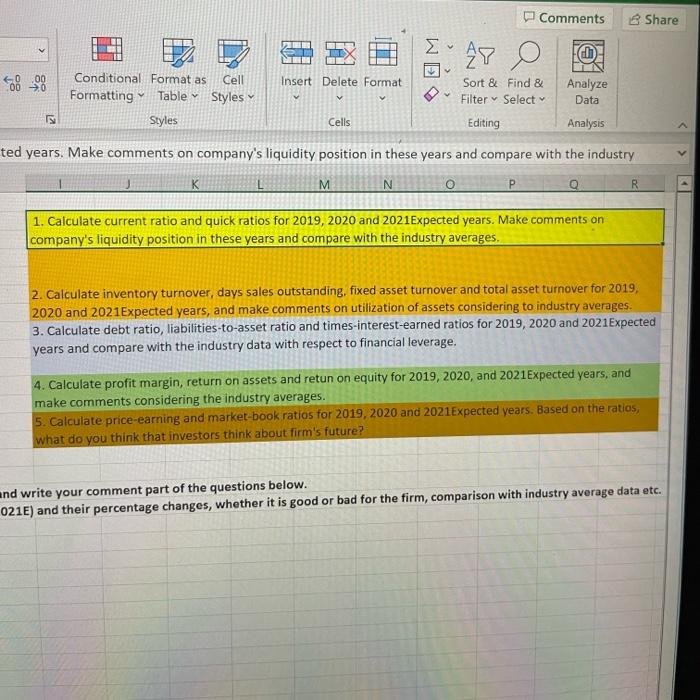
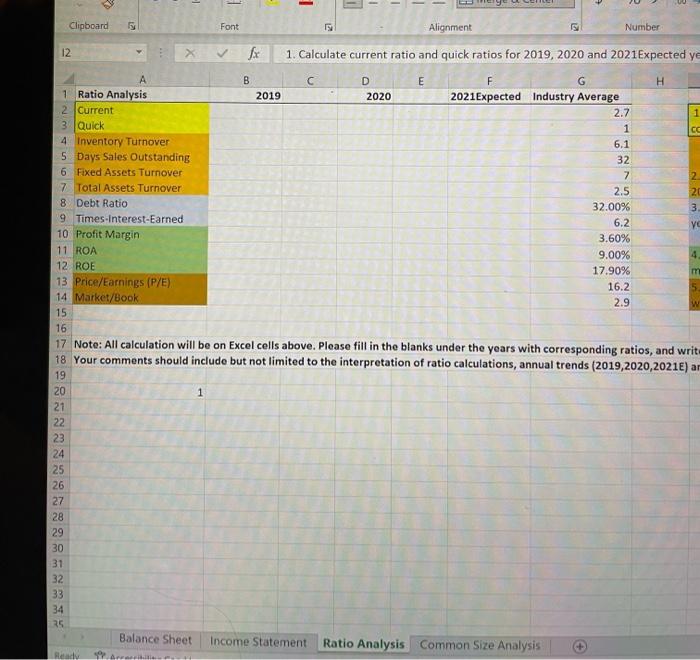
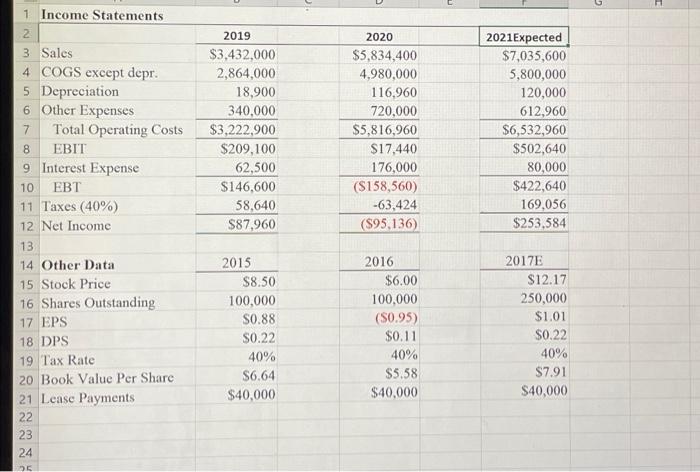
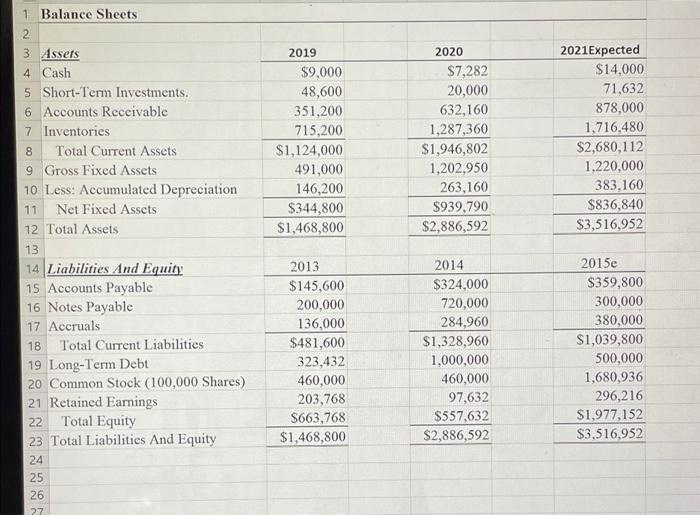
Comments Share v A O v 00 Insert Delete Format Conditional Format as Cell Formatting Table Styles Styles Sort & Find & Filter Select Analyze Data Cells Editing Analysis ted years. Make comments on company's liquidity position in these years and compare with the industry K M N R . 1. Calculate current ratio and quick ratios for 2019, 2020 and 2021Expected years. Make comments on company's liquidity position in these years and compare with the industry averages, 2. Calculate inventory turnover, days sales outstanding, fixed asset turnover and total asset turnover for 2019, 2020 and 2021 Expected years, and make comments on utilization of assets considering to industry averages. 3. Calculate debt ratio, liabilities-to-asset ratio and times-interest-earned ratios for 2019, 2020 and 2021 Expected years and compare with the industry data with respect to financial leverage. 4. Calculate profit margin, return on assets and retun on equity for 2019, 2020, and 2021Expected years, and make comments considering the industry averages. 5. Calculate price-earning and market-book ratios for 2019, 2020 and 2021Expected years. Based on the ratios, what do you think that investors think about firm's future? and write your comment part of the questions below. 021E) and their percentage changes, whether it is good or bad for the firm, comparison with industry average data etc. -1 1 - - Clipboard Font Alignment Number 12 fax 1. Calculate current ratio and quick ratios for 2019, 2020 and 2021Expected ye 18 - Nm A B C D E F G H 1 Ratio Analysis 2019 2020 2021Expected Industry Average 2 Current 2.7 3 Quick 1 4 Inventory Turnover 6.1 5 Days Sales Outstanding 32 6 Fixed Assets Turnover 7 7 Total Assets Turnover 2.5 8 Debt Ratio 32.00% 3 9 Times Interest-Earned 6.2 vo 10 Profit Margin 3.60% 11 ROA 9.00% 12 ROE 17.90% 13 Price/Earnings (P/E) 16.2 14 Market/Book 2.9 15 16 17 Note: All calculation will be on Excel cells above. Please fill in the blanks under the years with corresponding ratios, and writ 18 Your comments should include but not limited to the interpretation of ratio calculations, annual trends (2019,2020,20215) ar 19 20 1 21 22 23 24 25 26 27 28 29 30 31 32 33 34 35 Balance Sheet Income Statement Ratio Analysis Common Size Analysis Red 9 G H 2019 $3,432,000 2,864,000 18,900 340,000 $3,222,900 $209,100 62,500 $146,600 58,640 $87,960 1 Income Statements 2 3 Sales 4 COGS except depr. 5 Depreciation 6 Other Expenses 7 Total Operating Costs 8 EBIT 9 Interest Expense 10 EBT 11 Taxes (40%) 12 Net Income 13 14 Other Data 15 Stock Price 16 Shares Outstanding 17 EPS 18 DPS 19 Tax Rate 20 Book Value Per Share 21 Lease Payments 22 23 24 2020 $5,834,400 4.980,000 116,960 720,000 $5,816,960 $17,440 176,000 (5158,560) -63,424 ($95.136) 2021Expected $7,035,600 5,800,000 120,000 612,960 $6,532,960 $502,640 80,000 $422,640 169,056 $253,584 2015 $8.50 100,000 S0.88 S0.22 40% S6.64 $40,000 2016 $6.00 100,000 (S0.95) $0.11 40% $5.58 $40,000 2017E $12.17 250,000 $1.01 $0.22 40% $7.91 S40,000 25 2019 $9,000 48,600 351,200 715,200 $1,124,000 491,000 146,200 $344,800 $1,468,800 2020 $7,282 20,000 632,160 1,287,360 $1,946,802 1,202,950 263,160 $939,790 $2,886,592 2021Expected $14,000 71,632 878,000 1,716,480 $2,680,112 1.220,000 383,160 $836,840 $3,516,952 8 1 Balance Sheets 2 3 Assets 4 Cash 5 Short-Term Investments. 6 Accounts Receivable 7 Inventories Total Current Assets 9 Gross Fixed Assets 10 Less: Accumulated Depreciation 11 Net Fixed Assets 12 Total Assets 13 14 Liabilities And Equity 15 Accounts Payable 16 Notes Payable 17 Accruals Total Current Liabilities 19 Long-Term Debt 20 Common Stock (100,000 Shares) 21 Retained Earnings 22 Total Equity 23 Total Liabilities And Equity 24 25 26 18 2013 $145,600 200,000 136,000 $481,600 323,432 460,000 203,768 $663,768 $1,468,800 2014 $324,000 720,000 284,960 $1,328,960 1,000,000 460,000 97,632 $557,632 $2,886,592 2015e $359,800 300,000 380,000 $1,039,800 500,000 1,680,936 296,216 $1,977,152 $3,516,952 A 27