

Question: Common-site analysis and differences in profitability and leverage Comparative financial statement data for Cool Brewery Ltd. and Northerfleerid. Iwo competitors. follow amounts in thousands Netales
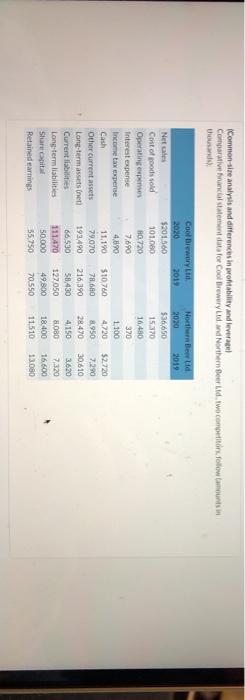


Common-site analysis and differences in profitability and leverage Comparative financial statement data for Cool Brewery Ltd. and Northerfleerid. Iwo competitors. follow amounts in thousands Netales Cost of soods sold Operating expenses Interest expense income tax opere Cash Other current assets Long-term assets net Current abilities Long-term liabilities Sharani Retained earnings Cool Brewery 2020 2017 $201.560 101.080 10.720 7.690 4,890 11.190 $10,760 79,070 78,660 193,490 216,390 66.530 58.430 111470 127050 50.000 49.800 55.750 70.550 Northern Berta 2020 2019 $36650 15.30 16400 370 1.100 4.720 $2.720 8.950 7.290 28.490 30.610 4150 3.620 SLOBO 7,320 18.400 16.600 11510 13080 * Your answer is incorrect Calculate the debt to quity ratio for both companies at the end of 2020. (Round answers to 2 decimal places 3.0.84) Cool Brewery Northern Beer Debt to equity ratio 1.68 0.41 x your answer is incorrect Calculate the net debt as a percentape of total capitalization for both companies. (Round answers to 1 decimal place, s. 15.1%) Cool Brewery Northern Beer Net debt as a percentage of total capitalization 627 % 290 %
Step by Step Solution
There are 3 Steps involved in it

Get step-by-step solutions from verified subject matter experts