

Question: Common-size statement analysis A common-size income statoment for Crook Enterprises 2018 operations follows Using the firm's 2010 income state develop the 2019 common-size income statement
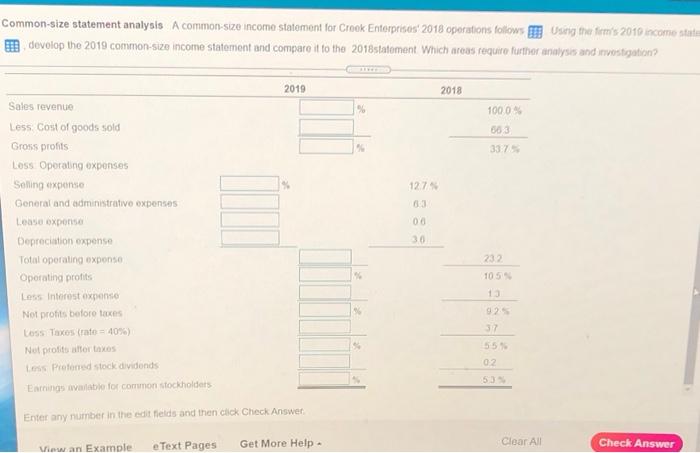
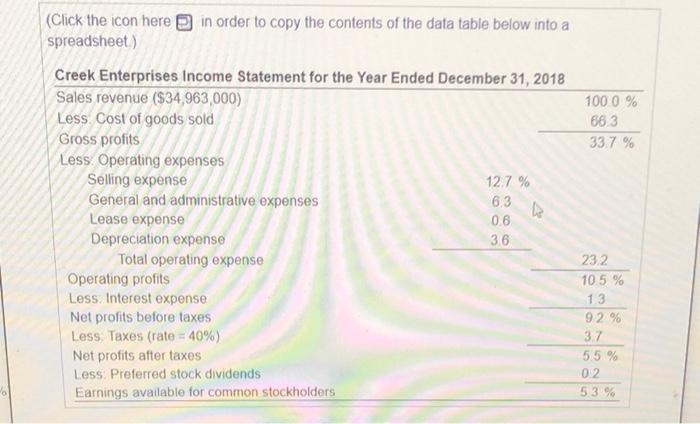
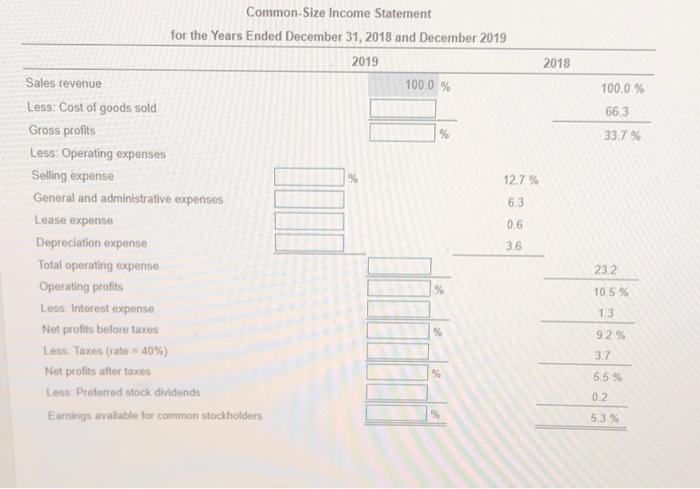
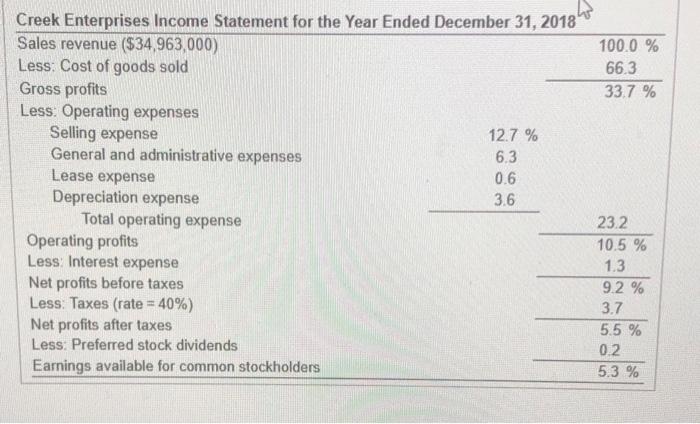
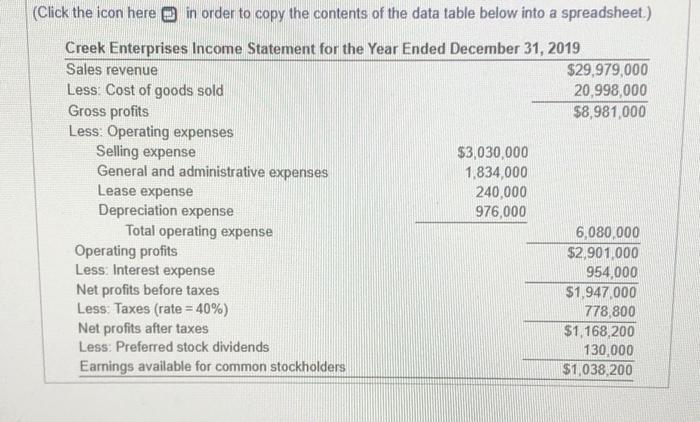
Common-size statement analysis A common-size income statoment for Crook Enterprises 2018 operations follows Using the firm's 2010 income state develop the 2019 common-size income statement and compare it to the 2018 statement which areas require further analysis and investigation? 2019 2018 Sales revenue 1000 663 337 Less Cost of goods sold Gross profits Less Operating expenses Selling expense General and administrative expenses 127 LOS Xons 00 30 232 10.5 Depreciation expense Total operating exponse Operating profits Less Interest expenso Not profits before taxes Loss Taxos Cat = 40%) Net profits for taxes Preferred stock dividonds Earnings valable for common stockholders 32 02 Enter any number in the edit fields and then click Check Answer e Text Pages Get More Help Clear All View and Example Check Answer 100.0 % 66.3 33 7 % (Click the icon here in order to copy the contents of the data table below into a spreadsheet) Creek Enterprises Income Statement for the Year Ended December 31, 2018 Sales revenue ($34,963,000) Less Cost of goods sold Gross profits Less Operating expenses Selling expense 12.7 % General and administrative expenses 6.3 Lease expense 06 Depreciation expense 3.6 Total operating expense Operating profits Less. Interest expense Net profits before taxes Less Taxes (rate = 40%) Net profits after taxes Less Preferred stock dividends Earnings available for common stockholders v 23.2 10.5 % 13 92% 3.7 5.5 % 0.2 53 % 100.0 % 663 33.7% Common-Size Income Statement for the Years Ended December 31, 2018 and December 2019 2019 2018 Sales revenue 100.0 % Less: Cost of goods sold Gross profits % Less: Operating expenses Selling expense % 12.7 % General and administrative expenses 6.3 Lease expense 0.6 Depreciation expense 36 Total operating expense Operating profits % Less: Interest expense Net profits before taxes Less Taxes (rute = 40% Net profits after taxes Lens Preferred stock dividends Earnings available for common stockholders % 23.2 10.5% 1.3 % 92% 3.7 5.5% 0.2 5.3% 100.0 % 66.3 33.7 % Creek Enterprises Income Statement for the Year Ended December 31, 2018 Sales revenue ($34,963,000) Less: Cost of goods sold Gross profits Less: Operating expenses Selling expense 12.7 % General and administrative expenses 6.3 Lease expense 0.6 Depreciation expense 3.6 Total operating expense Operating profits Less: Interest expense Net profits before taxes Less. Taxes (rate = 40%) Net profits after taxes Less: Preferred stock dividends Earnings available for common stockholders 23.2 10.5 % 1.3 9.2 % 3.7 5.5 % 0.2 5.3 % (Click the icon here in order to copy the contents of the data table below into a spreadsheet.) Creek Enterprises Income Statement for the Year Ended December 31, 2019 Sales revenue $29,979,000 Less: Cost of goods sold 20.998,000 Gross profits $8,981,000 Less: Operating expenses Selling expense $3,030,000 General and administrative expenses 1,834,000 Lease expense 240.000 Depreciation expense 976,000 Total operating expense 6,080,000 Operating profits $2,901,000 Less: Interest expense 954,000 Net profits before taxes $1,947,000 Less: Taxes (rate = 40%) 778,800 Net profits after taxes $1,168,200 Less: Preferred stock dividends 130.000 Earnings available for common stockholders $1,038,200
Step by Step Solution
There are 3 Steps involved in it

Get step-by-step solutions from verified subject matter experts