

Question: Common-sized balance sheets (all items scaled by total assets), common sized income statements (all items scaled by net sales), and selected financial ratios for the
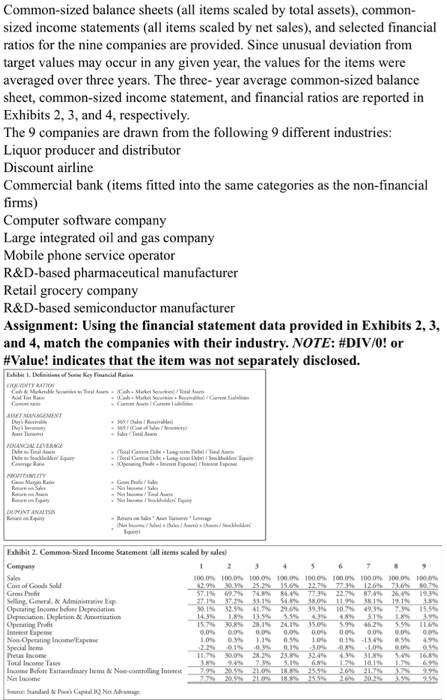
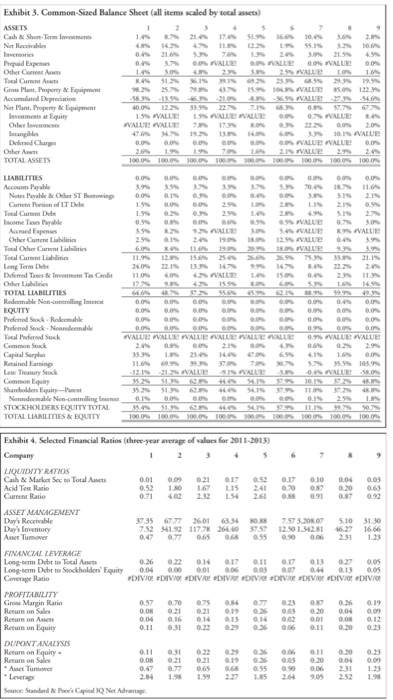
Common-sized balance sheets (all items scaled by total assets), common sized income statements (all items scaled by net sales), and selected financial ratios for the nine companies are provided. Since unusual deviation from target values may occur in any given year, the values for the items were averaged over three years. The three- year average sheet, common-sized income statement, and financial ratios are reported in Exhibits 2, 3, and 4, respectively The 9 companies are drawn from the following 9 different industries Liquor producer and distributor Discount airline Commercial bank (items fitted into the same categories as the non-financial firms) Computer software Large integrated oil and gas company Mobile phone service operator R&D-based pharmaceutical manufacturer Retail grocery company R&D-based semiconductor manufacturer Assignment: Using the financial statement data provided in Exhibits 2, 3, and 4, match the companies with their industry. NOTE: #DIV/0! or #Value! indicates that the item was not separately disclosed. comm on-sized balance company Exhibit 2. Common Sized Income Statement (all ieems scaled by sales) Company Cost of Goods Sol Gross Poit Opcrating Prot 1.0% 225 0,5% 1.1% 0.5% 10% 0.1% -13.4% 0.5% 4.9% lotal Income Tases Income Before Extraordinary lems &Noa-conerolling Inees
Step by Step Solution
There are 3 Steps involved in it

Get step-by-step solutions from verified subject matter experts