

Question: Comparable Analysis Below is data on 6 different companies Please answer the questions in yellow using an Excel Formula: Answer must be written using an
Comparable Analysis
Below is data on 6 different companies
Please answer the questions in yellow using an Excel Formula:
Answer must be written using an Excel Formula
Thank You
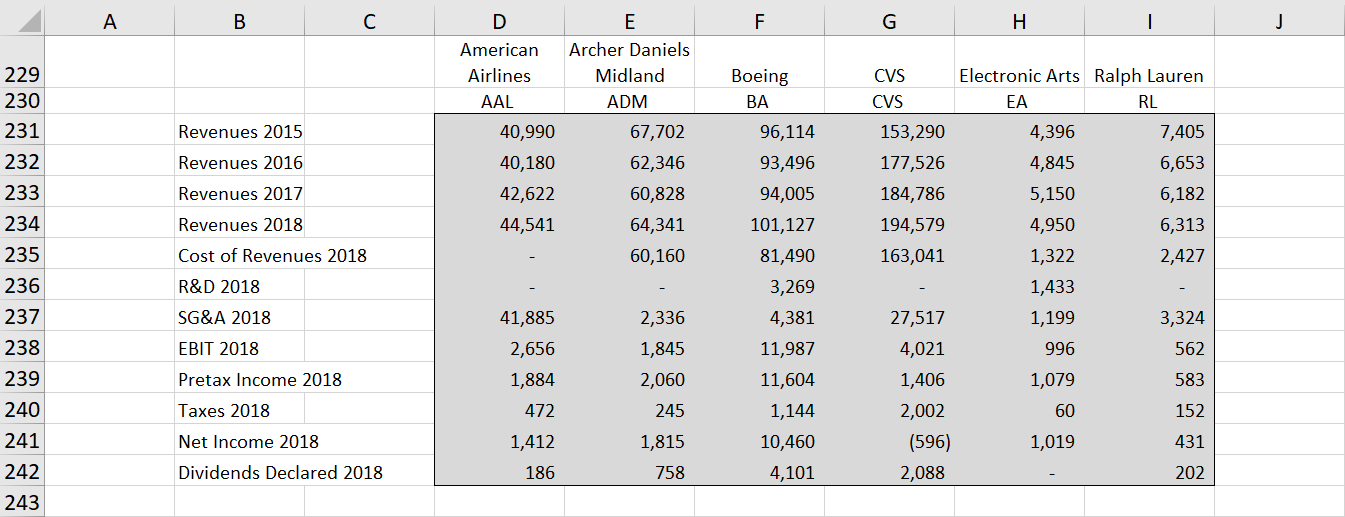
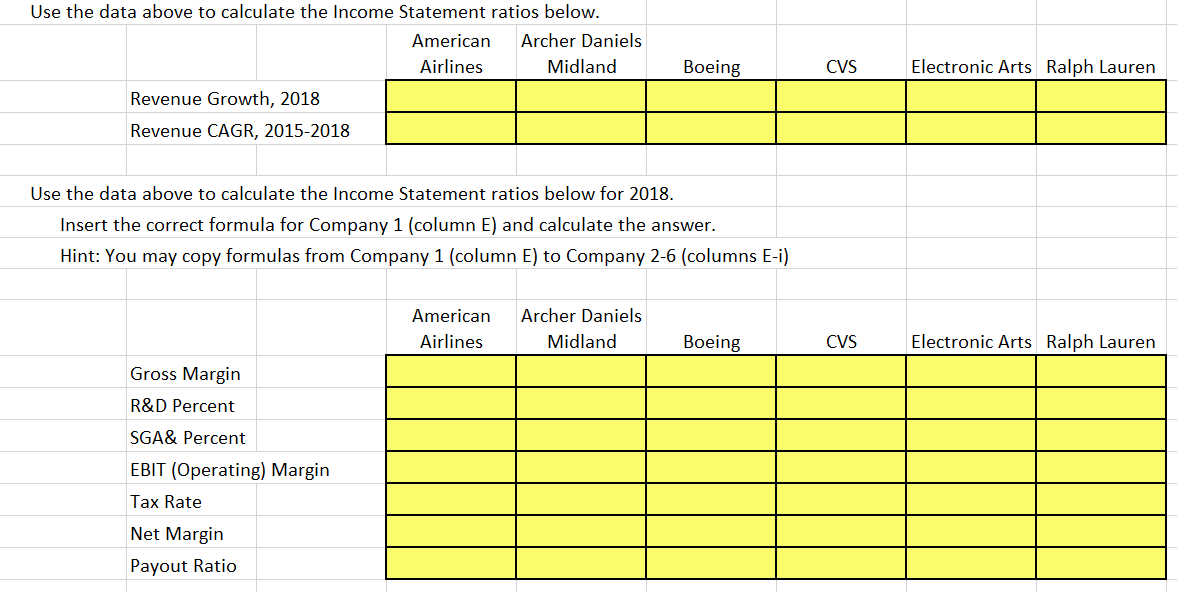
A B C F G H | J D American Airlines AAL E Archer Daniels Midland ADM Boeing CVS CVS Revenues 2015 Revenues 2016 Revenues 2017 229 230 231 232 233 234 235 236 237 238 239 40,990 40,180 42,622 44,541 67,702 62,346 60,828 64,341 60,160 153,290 177,526 184,786 194,579 163,041 Electronic Arts Ralph Lauren EA RL 4,396 7,405 4,845 6,653 5,150 6,182 4,950 6,313 1,322 2,427 1,433 1,199 3,324 996 562 Revenues 2018 Cost of Revenues 2018 96,114 93,496 94,005 101,127 81,490 3,269 4,381 11,987 11,604 1,144 10,460 4,101 R&D 2018 SG&A 2018 EBIT 2018 41,885 2,656 1,884 2,336 1,845 Pretax Income 2018 583 2,060 245 27,517 4,021 1,406 2,002 (596) 2,088 1,079 60 240 Taxes 2018 472 152 Net Income 2018 1,815 1,019 431 241 242 1,412 186 Dividends Declared 2018 758 202 243 Use the data above to calculate the Income Statement ratios below. American Archer Daniels Airlines Midland Revenue Growth, 2018 Revenue CAGR, 2015-2018 Boeing CVS Electronic Arts Ralph Lauren Use the data above to calculate the Income Statement ratios below for 2018. Insert the correct formula for Company 1 (column E) and calculate the answer. Hint: You may copy formulas from Company 1 (column E) to Company 2-6 (columns E-i) American Airlines Archer Daniels Midland Boeing CVS Electronic Arts Ralph Lauren Gross Margin R&D Percent SGA& Percent EBIT (Operating) Margin Tax Rate Net Margin Payout Ratio
Step by Step Solution
There are 3 Steps involved in it

Get step-by-step solutions from verified subject matter experts