

Question: please answer all questions with the given excel sheet and show work please Arial 10 ' ' = = Date ID Paste Conditional Form 9.
please answer all questions with the given excel sheet and show work please 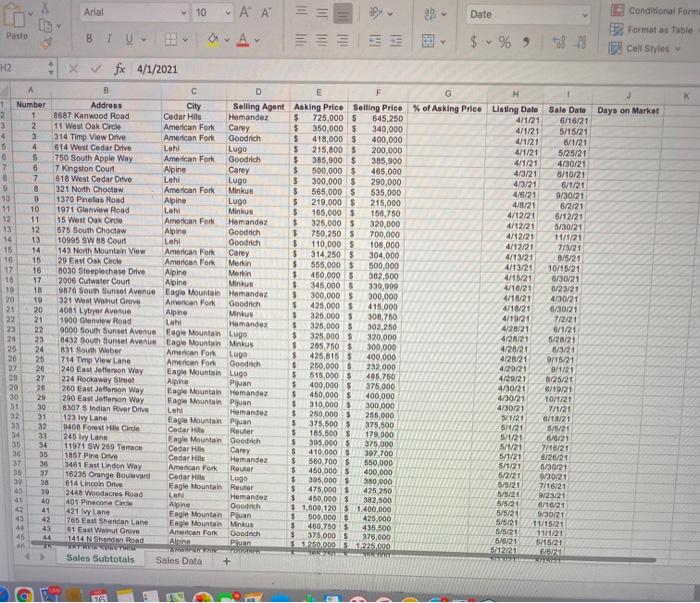
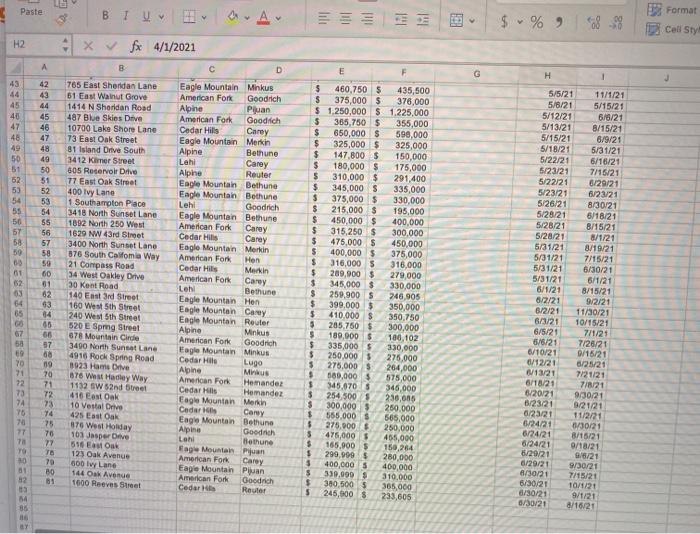
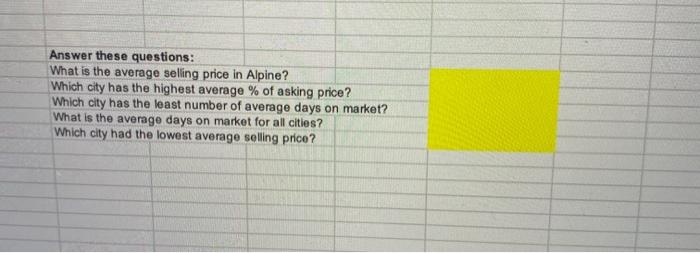
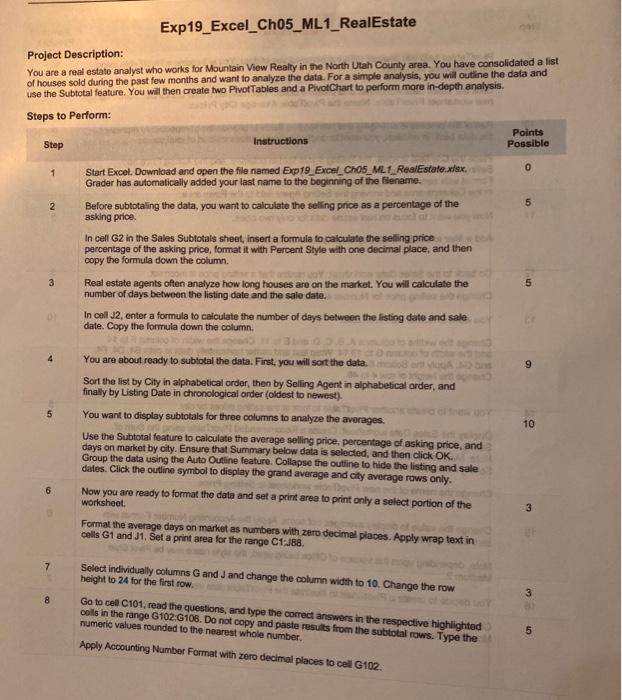
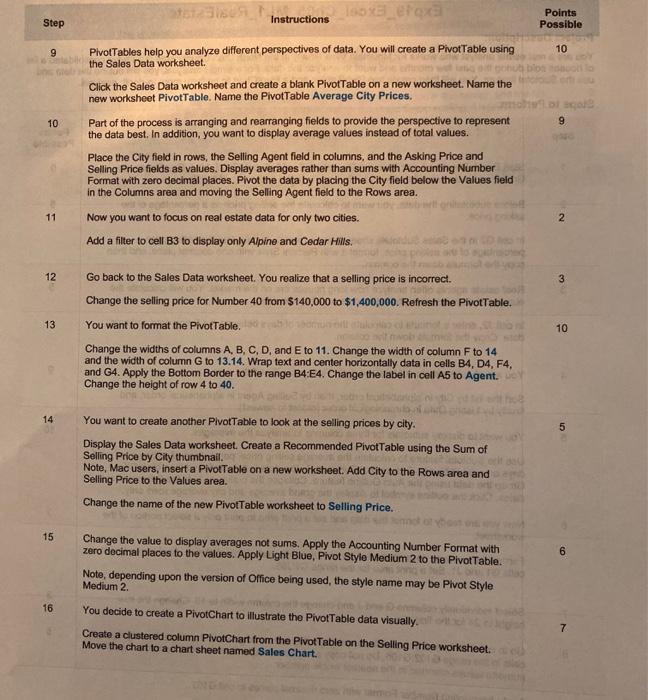
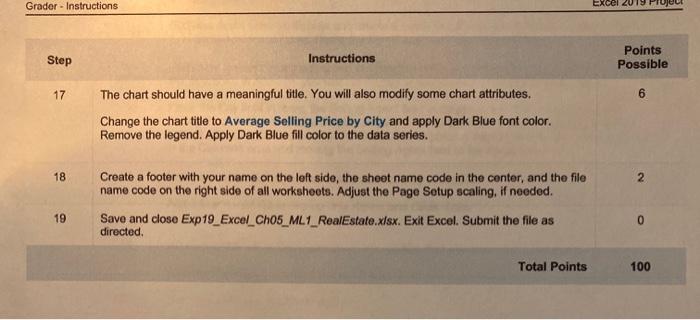
Arial 10 ' ' = = Date ID Paste Conditional Form 9. Format us Table Cell Styles LU BI INI $ % ) a89 H2 Xfx 4/1/2021 A B D E G H 1 Number Address City Selling Agent Asking Price Selling Price% of Asking Price Listing Date Sale Date Days on Market 2 1 8687 Kenwood Road Cedar Hits Homandoz $ 725,000 $ 545,250 4/1/21 6/16/21 3 2 11 West Oak Circle American Fork Carey $ 350,000 $ 340,000 4/1/21 5/15/21 4 3 314 Timp View Drive American Fork Goodrich $ 418,000 $ 400,000 4/1/21 6/1/21 4 614 West Cedar Drive Lahi Lugo $ 215,800 $ 200.000 4/1/21 5/25/21 5 750 South Apple Way American Fork Goodrich $ 385,900 $ 385,900 4/1/21 4/30/21 7 6 7 Kingston Court Alpine Carey $ 500,000 $ 465,000 4/3/21 0/10/21 8 7 618 West Cedar Drive Lohi Lugo $ 300,000 $ 290,000 4/3/21 6/1/21 9 8 321 North Choctaw American Fork Minkus $ 565,000 $ 535,000 4/8/21 9/30/21 10 9 1370 Pinelas Road Alpine Lugo $ 219,000 $ 215,000 4/8/21 6/2/21 11 10 1971 Glenview Road Leht Minkus $ 165,000 $ 150,750 4/12/21 6/12/21 12 11 15 Wout Oak Circle American Fork Hemandez $ 325,000 $ 320,000 4/12/21 5/30/21 13 12 575 South Choctaw Alpine Goodrich $ 750,2505 700,000 4/12/21 11/1/21 14 10995 SW 88 Court Lohi Goodrich $ 110,000$ 108,000 4/12/21 7/21 15 14 149 North Mountain View American Fork Carey 3 314 250 $ 304,000 4/13/21 8/5/21 10 15 29 East Oak Circle American Fork Merlin $ 555,000 $ 500,000 4/4321 17 10/15/21 16 8030 Steeplechase Drive Alpine Martin $ 450,000 $ 302,600 16 4/15/21 8/30/21 17 2006 Cutwater Court Alpine Minkus $ 345,000 339,000 4/18/21 6/23/21 10 18 0676 Soun Sunset Avenue Eagle Mountain Homandez $ 300,000 5 300,000 4/18/21 20 321 West Walnut Grove 4/30/21 10 American Fork Goodrich $ 425,000 $ 415.000 4/18/21 5/30/21 21 20 4081 Lyber Avenue Alpine Minkus $ 325,000 $ 308,750 4/19/21 7/2/21 22 21 1000 Glenview Road Lahi Homandos $ 325,000 $ 302,250 4/28/21 6/1/21 22 9000 South Sunset Avenue Eagle Mountain Lugo $ 325.000 20 320.000 4/20/21 5/20/21 23 6432 Soun Sunset Avenue Eagle Mountain Minkus $ 265,750 $ 25 24 831 South Weber 300,000 4/28/21 6/3/21 American Pork $ 425,815 400,000 20 25 714 Timp View Lane 4/28/21 9/19921 American Fork Goodrich $ 260,000 S 20 240 East Jefferson Way 22 232.000 4/20/21 9/1/21 Eagle Mountain Lugo $ 28 27 515,000 485.750 224 Rockaway Street 4/20/21 Br5/21 Alpha Puan 5 400,000 $ 20 75 200 East Jefferson Way 375,000 4/30/21 Eagle Mountain Hemandez 6/10/21 $ 450,000 $ JO 20 290 East Jefferson Way 400,000 Eagle Mountain Puan 4/30/21 10/1/21 310.000 $ 31 30 8107 S Indian Rover Drive 300.000 4/30/21 7/1/21 Le Homandos $ 250,000 12 31 123 Ivy Lane 255,000 Eagle Mountain Pjuan 5/1/21 a/1121 $ 375,500 5 23 32 0408 Forest Hills Circle 375,500 5/9/20 6/5/21 Cedare Router $ 34 33 245 Ivy Lane 185,500 $ 179,000 Eagle Mountain Goodrich 5/1/21 620/21 395.000 375.000 35 34 11071 SW 269 Tema 5/1/21 Cedar Hils Carey 7/18/21 $ 36 35 1867 Pine Dive 410,000 397.100 Cedar Hills 5/1/21 8/20/21 Hemandez $ 560,700 $ 36 3461 East Lndon Way 550,000 5/1/21 American Fork 5/20/21 Route S 450,000 35 37 16235 Orange Boulevard 400,000 5/2/21 Cadar Hils Lugo 9/30/21 $ 395,000 $ 614 Lincoln Drive 380.000 5/5/21 7/16/21 Eagle Mountain Restor $ 475,000 $ 39 40 425.250 2448 Woodacres Road LON Hemandez 5/5/20 9/2321 $ 450,000 $ 41 40 401 Pinecona Cece 382,500 6/5/21 Alpine 8/1621 Goodnich 41 421 ivy Lane 1 1,500,120 $ 1.400,000 5/5/21 Eagle Mountain Pjuan 9/30/21 500,000 $ $ 43 42 765 East Shandan Lane 425.000 5/5/21 Eagle Mountain Minkus $ 400.7505 11/15/21 44 43 61 East Weintrove 435.500 5/5.21 American Fork Goodrich $ 11/1/21 375,000 $375,000 45 44 1414 N Shenden Road Alpine Pijuan 5/15/21 RET 5 1250.000.150.225.000 54221 6/5/21 Sales Subtotals Sales Data + LUP 5/8/21 a HA Paste 3 ICE $ % ) Format Cell Sty H2 x fx 4/1/2021 B D E F G H 1 43 45 40 47 48 49 50 51 52 53 54 55 50 57 58 50 60 01 62 09 64 65 42 765 East Shendan Lane 43 61 East Wainut Grove 44 1414 N Sheridan Road 45 487 Blue Skies Drive 46 10700 Lake Shore Lane 47 73 East Oak Street 81 Island Drive South 49 3412 Kamer Street 50 805 Reservoir Drive 51 77 East Oak Street 52 400 lvy Lane 53 1 Southampton Place 54 3418 North Sunset Lane 55 1092 North 250 West 56 1629 NW 43rd Street 57 3400 North Sunset Lane 58 876 South Califomia Way 50 21 Compass Road 00 34 West Oakley Drive 31 30 Kont Road 62 140 East 3rd Street 63 160 West sth Street 84 240 West Sth Street 65 520 E Spring Street 878 Mountain Circle 57 3490 North Sunset Land 88 4916 Rock Spring Road 19 8923 Home Drive 70 676 West Hadley Way 71 1132 SW 52nd Street 72 416 East Oak 73 16 Vestal Drive 74 425 East On 75 8T6 West Honday 70 103 Jasper Dive 77 516 EO 78 123 Oak Avenue 70 500 lvy Lane 80 144 Ok Avenue 1600 Reeves Street Eagle Mountain Minkus American Fork Goodrich Alpine Pijuan American Fork Goodrich Cadar Hills Carey Eagle Mountain Merkin Alpine Bethune Lahi Carey Alpine Router Eagle Mountain Bethune Eagle Mountain Bethune Lehi Goodrich Eagle Mountain Bethune American Fork Carey Cedar Hills Carey Eagle Mountain Merkin American Fork Hen Cedar Hilis Merkin American Fon Carey Leh Bethune Eagle Mountain Hen Eagle Mountain Carey Eagle Mountain Reuter Alpine Minkus American Fork Goodrich Eagle Mountain Minkus Cedar Hile Lugo Alpine Mirkus American Fork Hernandez Cedar Hils Hemandez Eagle Mountain Merkin Cadar Carey Eagle Mountain Bethune Alpine Goodrich Lohi Bethune Eagle Mountain Puan American Fork Carey Eagle Mountain Pijuan American Fork Goodrich Cedar H Router $ 460,750 $ 435,500 $ 375,000 $ 376,000 $ 1,250,000 $ 1.225.000 $ 365,750 $ 355,000 $ 650,000 $ 590,000 $ 325,000 $ 325,000 $ 147,800 $ 150,000 $ 180,000 $ 175,000 5 310,000 $ 291,400 $ 345,000 $ 335,000 $ 375,000 $ 330,000 $ 215,000 $ 195.000 $ 450,000 $ 400,000 $ 315,250 $ 300.000 $ 475,000 $ 450,000 S 400,000 $ 375,000 $ 316,000 $ 316,000 $ 289,900 $ 279.000 $ 345,000 $ 330,000 $ 259.900 S 248.905 $ 399,000 5 350,000 5 410,000 $ 350.750 5 205.750 $ 300,000 $ 189,00D 180,102 $ 335,000 $ 330,000 $ 250,000 $ 276.000 $ 275,000 $ 264,000 $ 680,000 $ 575,000 $ 345.0708 345.000 $ 254,500 5 230,005 $ 300,000 250.000 565.000 565,000 $ 275.000 250,000 $ 475,000 $ 455,000 $ 165,900 $ 150,284 $ 299,999 $ 280.000 $ 400,000 5 400.000 $ 339,999 $ 310,000 S 380.500 5 365.000 5 245,000 $ 233,605 5/5/21 5/8/21 5/12/21 5/13/21 5/15/21 5/18/21 5/22/21 5/23/21 5/22/21 5/23/21 5/26/21 5/28/21 5/28/21 5/28/21 5/31/21 5/31/21 5/31/21 5/31/21 6/1/21 8/2/21 6/2/21 6/3/21 6/5/21 5/6/21 6/10/21 6/12/21 w/1321 6/18/20 8/20/21 8/23/21 0/25/21 6/24/21 6/24/21 6/24/21 8/20/21 6/29/21 8/30/21 6/30/21 8/30/21 a/3021 1 1/1/21 5/15/21 6/8/21 8/15/21 6/9/25 5/31/21 6/16/21 7/15/21 6/29/21 6/2321 8/30/21 6/18/21 8/15/21 8/1/21 8/19/21 7/15/21 6/30/21 6/1/21 8/15/21 9/2/21 11/30/21 10/15/21 7/1/21 7/28/21 9/16/21 8/25/21 7/21/21 7/8/21 9/30/21 9/21/21 11/2/21 0/30/21 8/15/21 9/18/21 9/6/21 9/30/21 7/15/21 10/1/2+ 9/1/21 8/10/21 67 69 70 72 73 74 78 70 77 7 79 30 81 52 34 is Answer these questions: What is the average selling price in Alpine? Which city has the highest average % of asking price? Which city has the least number of average days on market? What is the averago days on market for all cities? Which city had the lowest average selling price? Exp19_Excel_Ch05_ML1_RealEstate Project Description: You are a real estate analyst who works for Mountain View Realty in the North Utah County area. You have consolidated a list of houses sold during the past few months and want to analyze the data. For a simple analysis, you will outline the data and use the Subtotal feature. You will then create two Pivot Tables and a PivotChart to perform more in-depth analysis. Steps to Perform: Points Possible Step Instructions 1 0 Start Excel. Download and open the file named Exp19 Excel_cho_ML1_RealEstate.xlsx. Grader has automatically added your last name to the beginning of the filename. Before subtotaling the data, you want to calculate the selling price as a percentage of the asking price. 2 5 In cell G2 in the Sales Subtotals sheet, insert a formula to calculate the selling price percentage of the asking price, format it with Percent Style with one decimal place, and then copy the formula down the column. 3 5 Real estate agents often analyze how long houses are on the market. You will calculate the number of days between the listing date and the sale date. In coll J2, enter a formula to calculate the number of days between the listing date and sale date. Copy the formula down the column. 4 5 You are about ready to subtotal the data. First, you will sort the data. Sort the list by City in alphabetical order, then by Selling Agent in alphabetical order, and finally by Listing Date in chronological order (oldest to newest). You want to display subtotals for three columns to analyze the averages. Use the Subtotal feature to calculate the average selling price, percentage of asking price, and days on market by city. Ensure that Summary below data is selected, and then click OK. Group the data using the Auto Outline feature. Collapse the outline to hide the listing and sale dates. Click the outline symbol to display the grand average and city average rows only. Now you are ready to format the data and set a print area to print only a select portion of the worksheet. 10 6 3 Format the average days on market as numbers with zero decimal places. Apply wrap text in cells G1 and J1. Set a print area for the range C1:388. 7 8 Select individually columns G and J and change the column width to 10. Change the row height to 24 for the first row. Go to cell C101, read the questions, and type the correct answers in the respective highlighted colls in the range G102.G106. Do not copy and paste results from the subtotal rows. Type the numeric values rounded to the nearest whole number, Apply Accounting Number Format with zero decimal places to cell G102 5 tot also onsoleto Step Instructions Points Possible 9 10 10 9 PlvotTables help you analyze different perspectives of data. You will create a Pivot Table using the Sales Data worksheet. Click the Sales Data worksheet and create a blank PivotTable on a new worksheet. Name the new worksheet PivotTable Name the PivotTable Average City Prices Part of the process is arranging and rearranging fields to provide the perspective to represent the data best. In addition, you want to display average values instead of total values. Place the City field in rows, the Selling Agent field in columns, and the Asking Price and Selling Price fields as values. Display averages rather than sums with Accounting Number Format with zero decimal places. Pivot the data by placing the City field below the Values field in the Columns area and moving the Selling Agent field to the Rows area. Now you want to focus on real estate data for only two cities. Add a filter to cell B3 to display only Alpine and Cedar Hills 11 2 12 3 Go back to the Sales Data worksheet. You realize that a selling price is incorrect. Change the selling price for Number 40 from $140,000 to $1,400,000. Refresh the Pivottable. 13 You want to format the Pivot Table 10 Change the widths of columns A, B, C, D, and Eto 11. Change the width of column F to 14 and the width of column G to 13.14. Wrap text and center horizontally data in cells B4, D4, F4, and G4. Apply the Bottom Border to the range B4:E4. Change the label in cell A5 to Agent. Change the height of row 4 to 40. 14 5 You want to create another PivotTable to look at the selling prices by city. Display the Sales Data worksheet. Create a Recommended Pivot Table using the Sum of Selling Price by City thumbnail Note, Mac users, insert a PivotTable on a new worksheet. Add City to the Rows area and Selling Price to the Values area. Change the name of the new PivotTable worksheet to Selling Price. 15 6 Change the value to display averages not sums. Apply the Accounting Number Format with zero decimal places to the values. Apply Light Blue, Pivot Style Medium 2 to the PivotTable. Note, depending upon the version of Office being used the style name may be Pivot Style Medium 2. 16 You decide to create a PivotChart to illustrate the PivotTable data visually Create a clustered column PivotChart from the Pivot Table on the Selling Price worksheet. Move the chart to a chart sheet named Sales Chart. 7 Grader - Instructions Excel 2019 vjec Step Instructions Points Possible 17 CO The chart should have a meaningful title. You will also modify some chart attributes. Change the chart title to Average Selling Price by City and apply Dark Blue font color. Remove the legend. Apply Dark Blue fill color to the data series. 18 2 Create a footer with your name on the left side, the shoot name code in the center, and the file name code on the right side of all worksheets. Adjust the Page Setup scaling, if needed. Save and close Exp19_Excel_Chos_ML1_RealEstate.xlsx. Exit Excel. Submit the file as directed 19 0 Total Points 100 Step by Step Solution
There are 3 Steps involved in it
1 Expert Approved Answer
Step: 1 Unlock

Question Has Been Solved by an Expert!
Get step-by-step solutions from verified subject matter experts
Step: 2 Unlock
Step: 3 Unlock