

Question: Comparative Advantage [Replace this area with the Production Decisions graph.] Figure 1.1 [Replace this area with the Production and Trade graph.] Figure 1.2 Comparative Advantage
![Comparative Advantage[Replace this area with the Production Decisions graph.]Figure 1.1[Replace this](https://s3.amazonaws.com/si.experts.images/answers/2024/06/6675c119ac1b4_1776675c1198a2e6.jpg)
![area with the Production and Trade graph.]Figure 1.2 Comparative Advantage [without Trade)](https://s3.amazonaws.com/si.experts.images/answers/2024/06/6675c11a249ea_1786675c11a08ac9.jpg)

Comparative Advantage
[Replace this area with the Production Decisions graph.]
Figure 1.1
[Replace this area with the Production and Trade graph.]
Figure 1.2
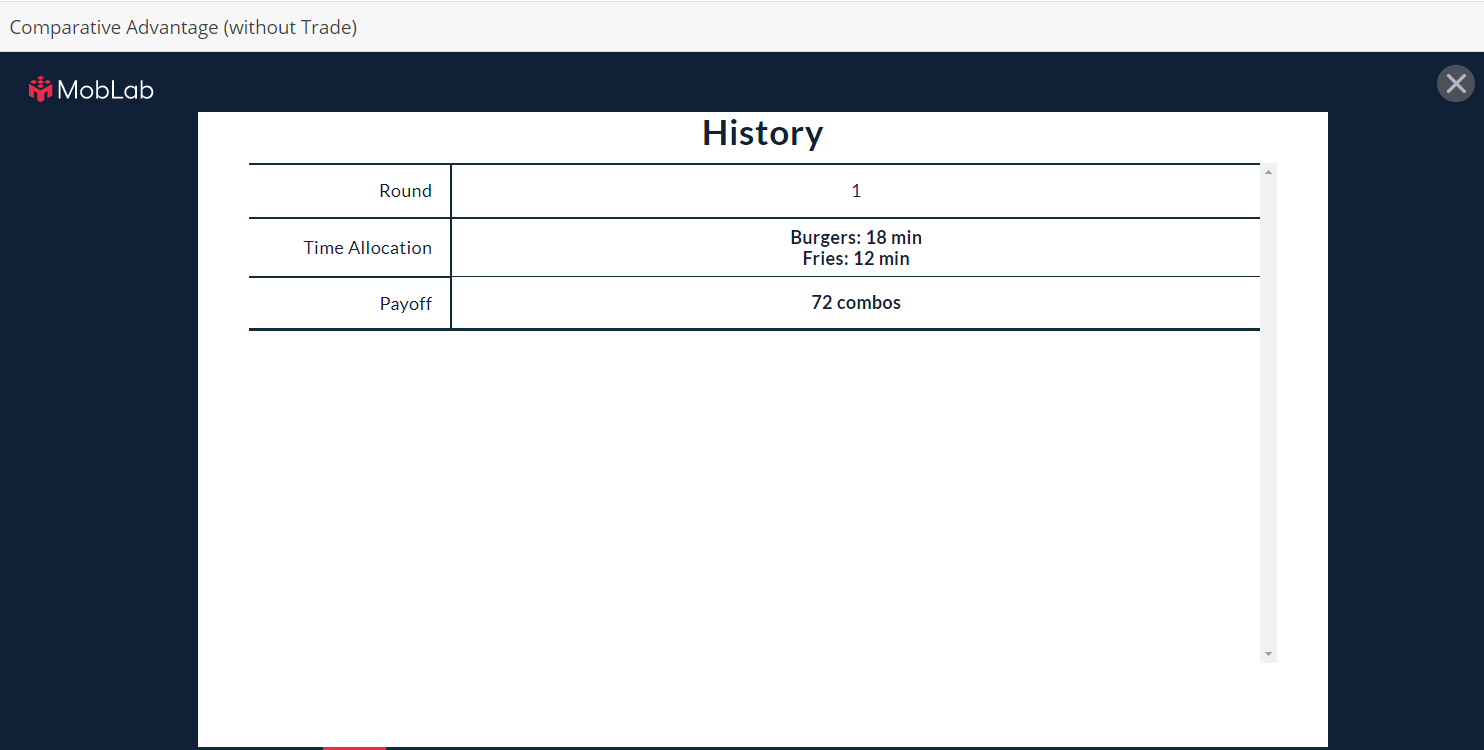
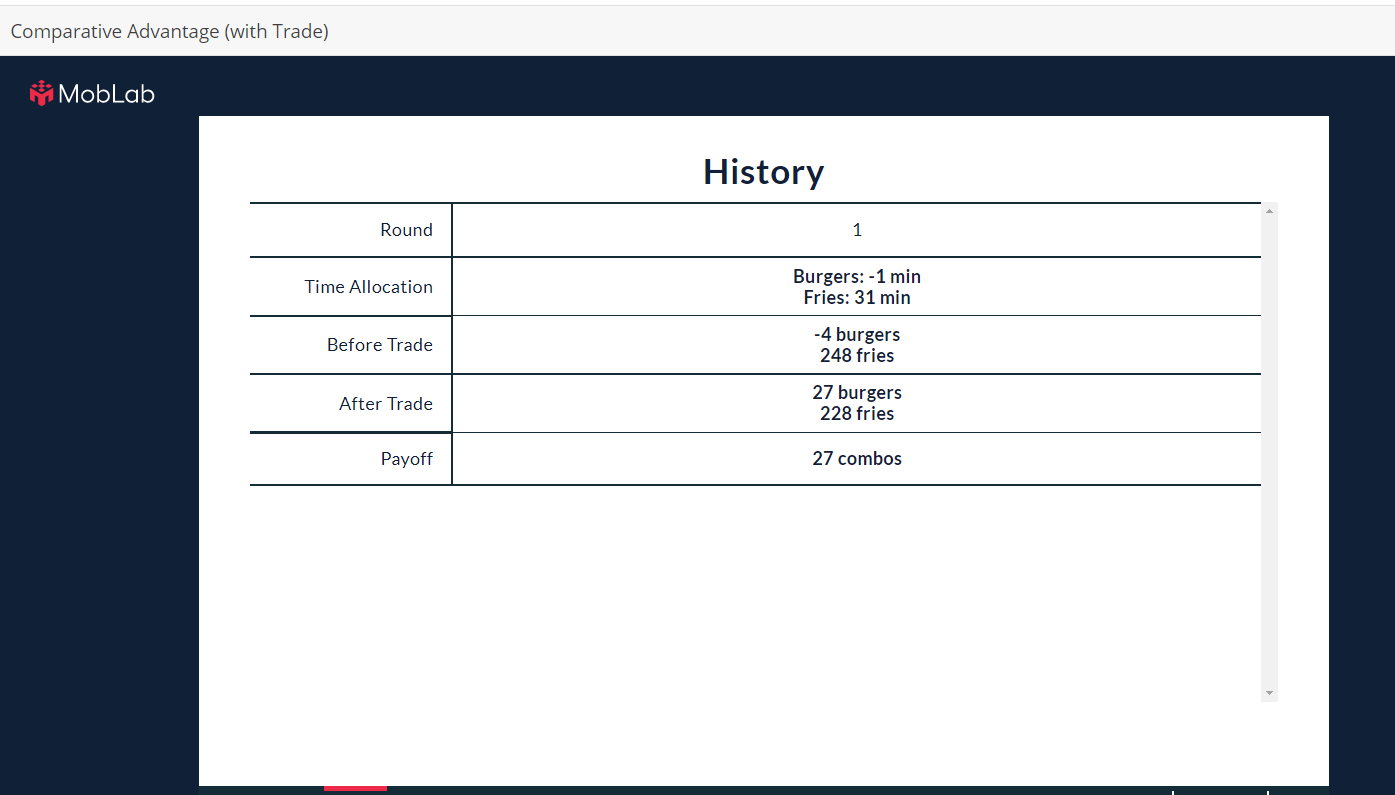

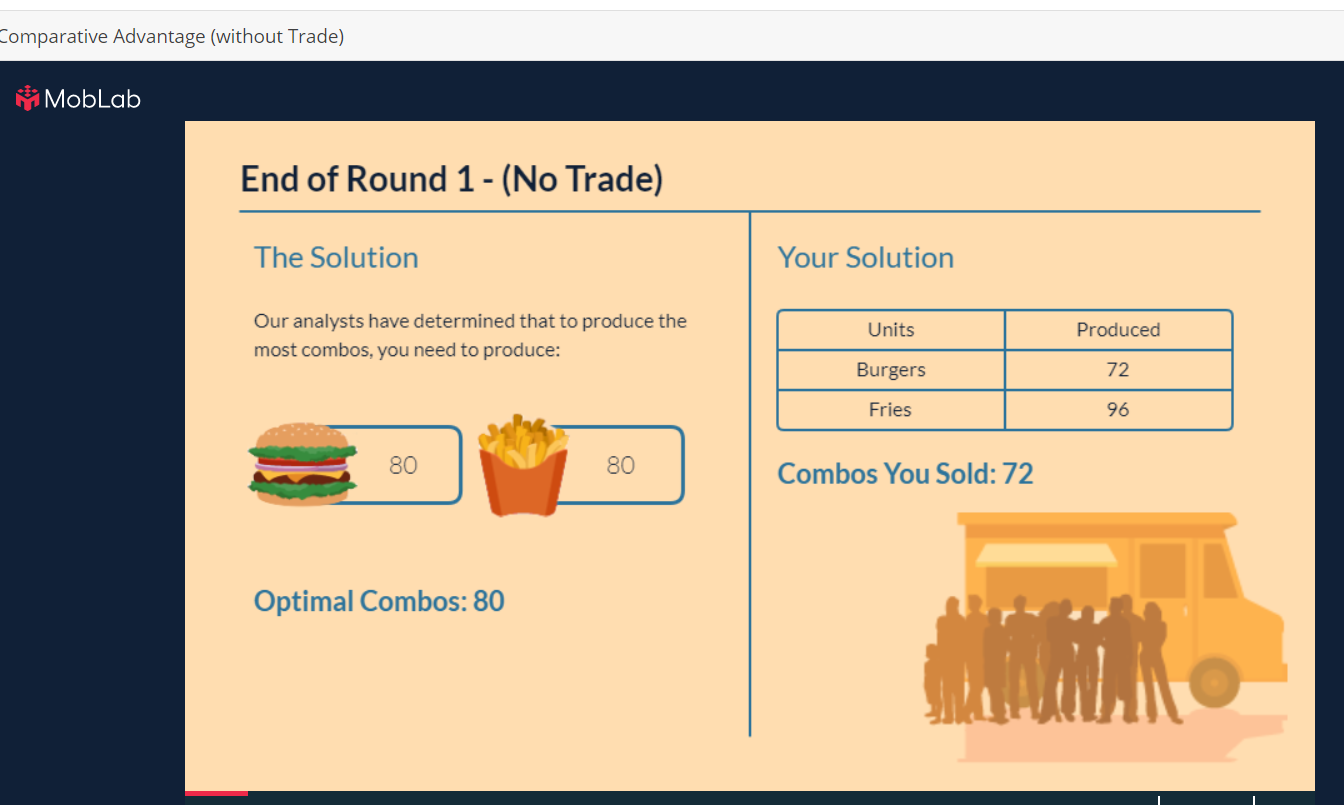
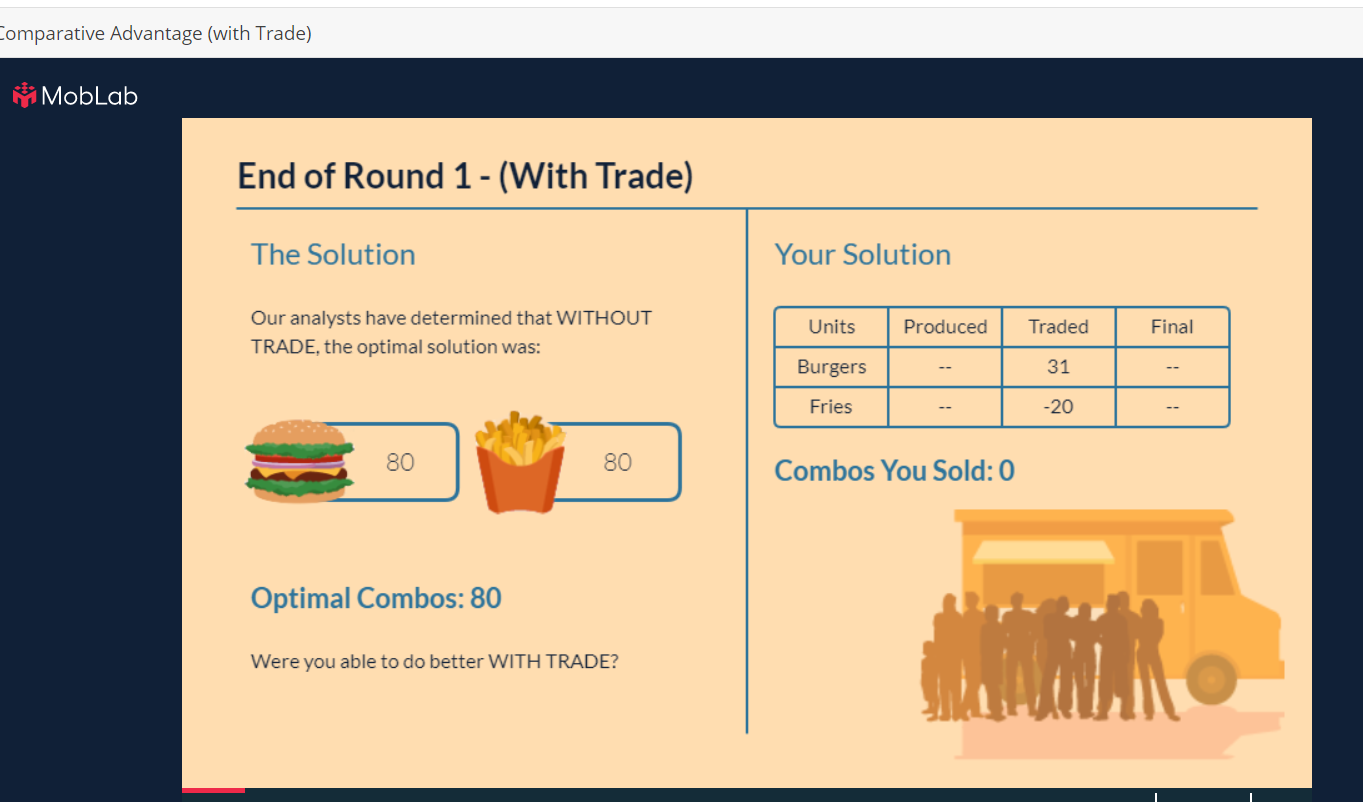
Comparative Advantage [without Trade) History Burgers: 18 min TxmeAllocatlon Fries: 12 min 72 combos Comparative Advantage [with Trade) History Burgers: -1 min Trme Allocation Fries: 31 mm -4 burgers Before Trade 248 fries 27 burgers After Trade 228 fries 27 combos Iompa rative Advantage [with Trade} End of Round 1 - (With Trade) The Solution Your Solution Our analysts have determined that WITHOUT TRADE, the optimal solution was: " " Combos You Sold: 0 Optimal Combos: 80 Were you able to do better WITH TRADE? Comparative Advantage [without Trade) End of Round 1 - (No Trade) The Solution Your Solution Our analysts have determined that to produce the most combos. you need to produce: Fries Combos You Sold: 72 Optimal Combos: 80 m
Step by Step Solution
There are 3 Steps involved in it

Get step-by-step solutions from verified subject matter experts