

Question: Comparative Balance Sheets December 31, 2017-2018 2017 2018 Assets AED AED Total Current Assets 812.000 870.000 Net Fixed Assets 1,430.000 1.000 Total Assets 2242.000 2,095,000
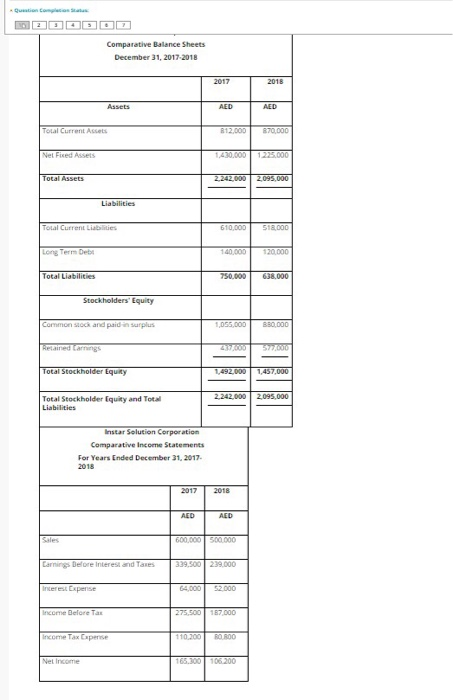
Comparative Balance Sheets December 31, 2017-2018 2017 2018 Assets AED AED Total Current Assets 812.000 870.000 Net Fixed Assets 1,430.000 1.000 Total Assets 2242.000 2,095,000 Liabilities Total Current Liabilities 610,000 518,000 Long Term Det 140,000 120 000 Total Liabilities 750.000 638,000 Stockholders' Equity Common stock and paid in surplus 1,055,000 830,000 Recared Carnings 3000 Total Stockholder Lquity 1,492.000 1,457,000 2.242.000 2.095,000 Total Stockholder (quity and Total Liabilities Instar Solution Corporation Comparative Income Statements For Years Ended December 31, 2017 2018 2017 2018 AED ALD 600.000 500.000 Carnings before interest and Tares 339,300239.000 Interest Expense 64,000 52.000 Income Before Tas 275.000 187.000 Income Tax Cepense 110.200 RORO Net Income 165.300106.200 Comparative Balance Sheets December 31, 2017-2018 2017 2018 Assets AED AED Total Current Assets 812.000 870.000 Net Fixed Assets 1,430.000 1.000 Total Assets 2242.000 2,095,000 Liabilities Total Current Liabilities 610,000 518,000 Long Term Det 140,000 120 000 Total Liabilities 750.000 638,000 Stockholders' Equity Common stock and paid in surplus 1,055,000 830,000 Recared Carnings 3000 Total Stockholder Lquity 1,492.000 1,457,000 2.242.000 2.095,000 Total Stockholder (quity and Total Liabilities Instar Solution Corporation Comparative Income Statements For Years Ended December 31, 2017 2018 2017 2018 AED ALD 600.000 500.000 Carnings before interest and Tares 339,300239.000 Interest Expense 64,000 52.000 Income Before Tas 275.000 187.000 Income Tax Cepense 110.200 RORO Net Income 165.300106.200
Step by Step Solution
There are 3 Steps involved in it

Get step-by-step solutions from verified subject matter experts