

Question: Comparative data, in thousands, is given below for Marble Company for the years' 2019 and 2018. Required: 1. Using the table below, complete a Vertical
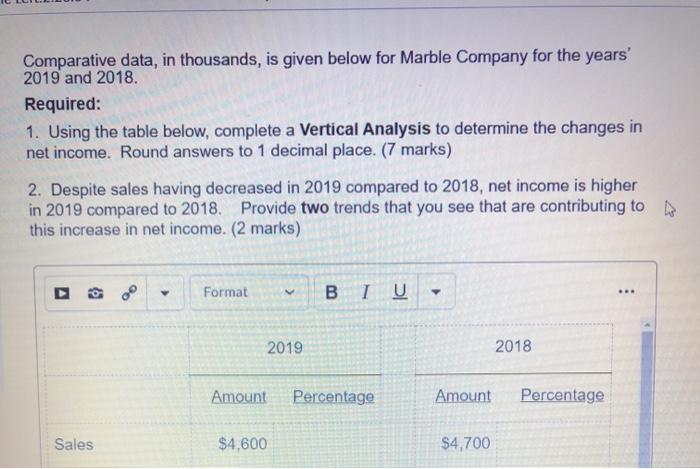
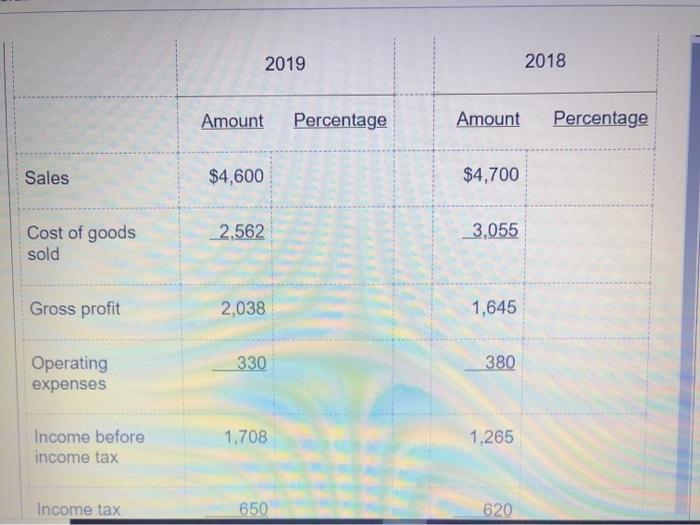
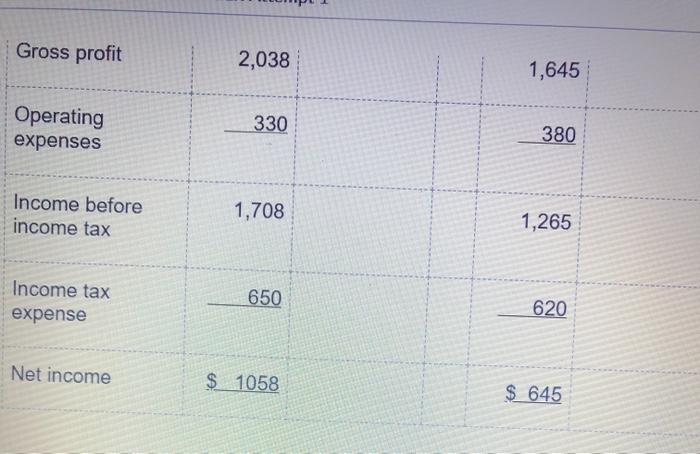
Comparative data, in thousands, is given below for Marble Company for the years' 2019 and 2018. Required: 1. Using the table below, complete a Vertical Analysis to determine the changes in net income. Round answers to 1 decimal place. (7 marks) 2. Despite sales having decreased in 2019 compared to 2018, net income is higher in 2019 compared to 2018. Provide two trends that you see that are contributing to this increase in net income. (2 marks) A Format BIU ... 2019 2018 Amount Percentage Amount Percentage Sales $4,600 $4,700 2019 2018 Amount Percentage Amount Percentage Sales $4,600 $4,700 2,562 3,055 Cost of goods sold Gross profit 2,038 1,645 330 380 Operating expenses 1,708 Income before income tax 1,265 Income tax 650 620 Gross profit 2,038 1,645 Operating expenses 330 380 Income before income tax 1,708 1,265 Income tax expense 650 620 Net income $ 1058 $ 645
Step by Step Solution
There are 3 Steps involved in it

Get step-by-step solutions from verified subject matter experts