

Question: help ACC 215 Financial Report 150 Point Assignment! Step 1: Select your companies. You may pick any two companies - examples are included at the
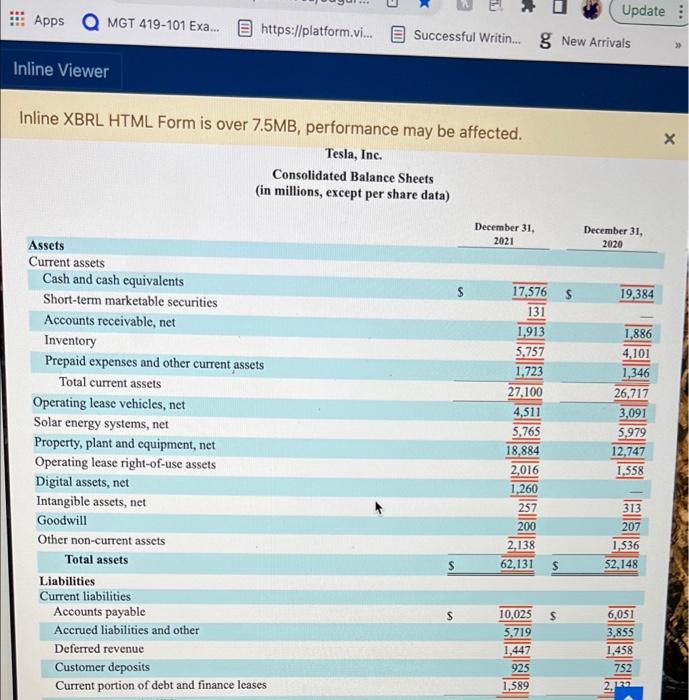
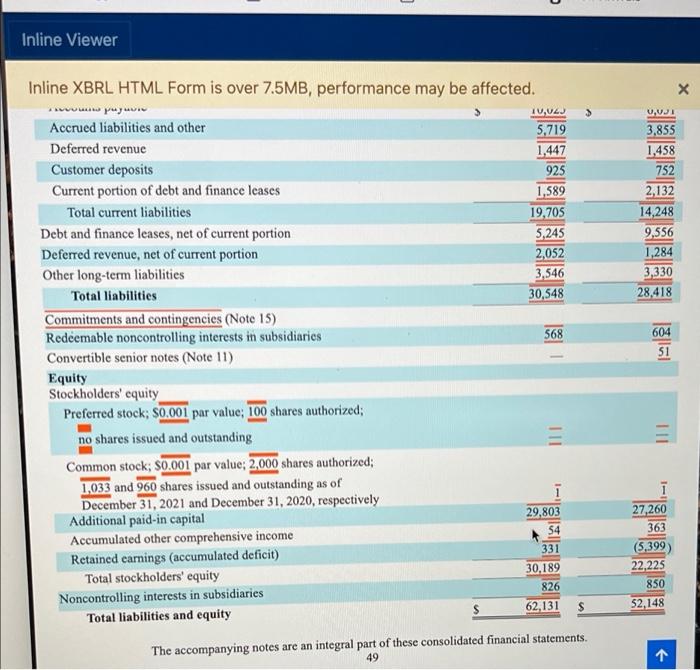
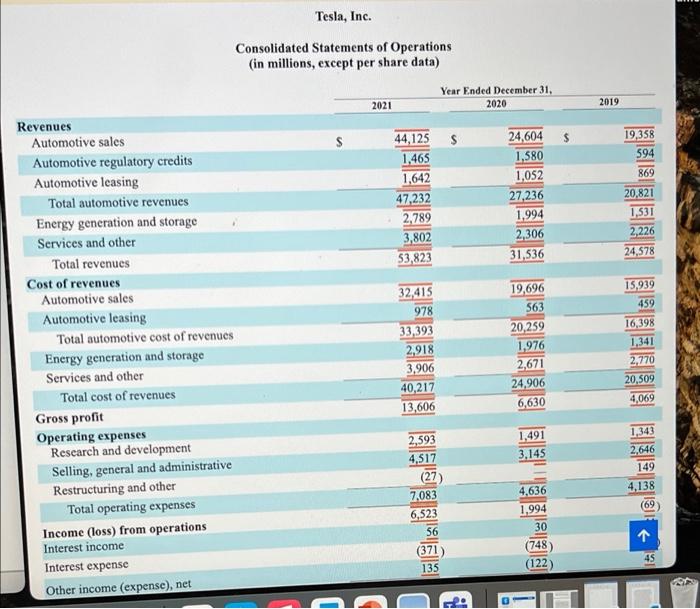
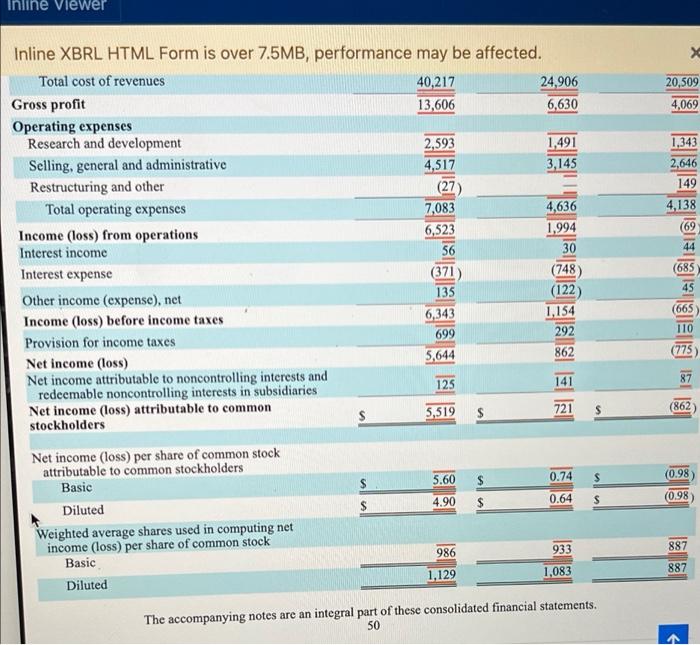
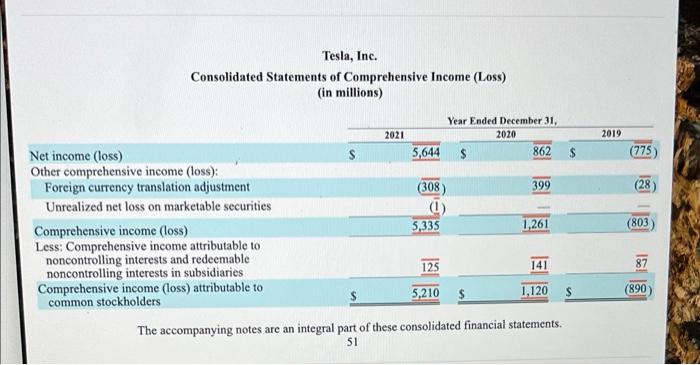
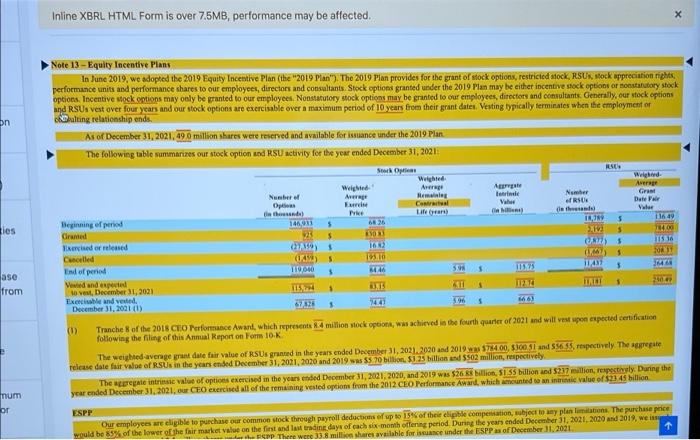
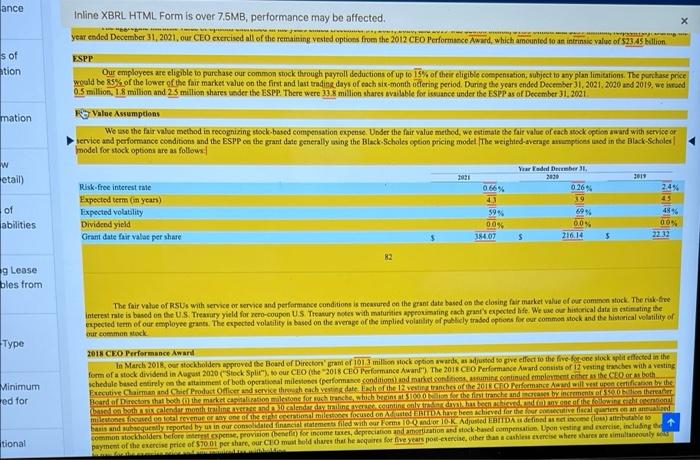
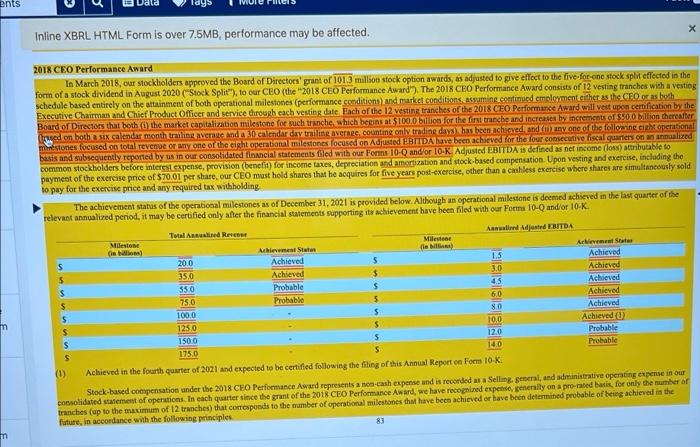
ACC 215 Financial Report 150 Point Assignment! Step 1: Select your companies. You may pick any two companies - examples are included at the end of this assignment. However, they must be from the same industry! Use the SIC as your guide to the industry not your intuition. Step 2: Locate and download (optional) your companies' form 10-K. The 10-K is an annual filing required by the Securities and Exchange Commission of all U.S. publicly traded companies. Among other things, the 10-K includes a public company's financial statements under Item 8 in the table of contents. They are available at sec gov. We will have a class session that walks you through locating form 10-K. WARNING: 10-K's may be HUNDREDS of pages long. You will only need to print a few selected pages from each item. Be careful before you hit "Print" Step 3: You will need the income statements and balance sheets for each of your companies for the most recent years available. Enter the income statements and balance sheets for your companies in an Excel spreadshoct. Use a separate worksheet for each company but only one workbook. Step 4: Complete the following financial analysis tools with each clearly labeled as noted below in your Excel document: 1. Perform a vertical analysis of each company for both years. The process for doing this will be discussed in class. 2. Perform a horizontal analysis of each company for the most recent year, The process for doing this will be discussed in class. 3. Obtain camnings per share (EPS) - EPS is the amount of net income eamed per share of the company's common stock. You will not have to calculate EPS figures because they are provided at the end of the company's income statement. Use the figures identified as "Basic EPS" for all operations. Calculate the price earnings (PE) ratio for the most recent two years. To do this, go to Google Finance and search for historical stock prices for your company. Use the closing date for the company (such as December 31, 2020) if the closing date is not a day when markets are open, use the first day available before the closing date. The information on calculating and analyzing the PE ratio is on page 426 and 504 of your text. 4. Current ratio - Calculate the current ratio for each company for both years. Focus day available before the closing date. The information on calculating and analyzing the PE ratio is on page 426 and 504 of your text. 4. Current ratio - Calculate the current ratio for each company for both years. The current ratio measures a company's liquidity. It is a proportion of current assets to current liabilities. Your book offers information about the current ratio on page 109 as well as on page 500. As is shown on page 109, be sure to provide the results of your calculations to two places after the decimal point. This is not a percentage S. Calculate the acid-test ratio for each company for both years. Similar to the current ratio, the acid test ratio also measures a company's liquidity. The ratio is discussed on page 158 in your text. This is not a percentage and should be expressed two places after the decimal place. On page 159, the answer for the current year for Nike would be 1.80. 6. Calculate the debt ratio for each company for each year. The debt ratio reflects a company's ability to meet its long-term obligations. Details about this ratio are provided on Page 63. NOTE: The example shows a result of 60 for the current year. That figure is really a percentage and should be reported with two places after the decimal point (69.51%). Be sure to report your debt ratio results in this format, 7. Calculate return on assets (ROA) for each company for the most recent year. ROA is a measure of how well a company uses its assets to produce profit. This ratio is discussed on Page 19 of your text. Again, be sure to report your results to two places after the decimal point. The result of the calculation shown on Page 19 is 18.99% 8. Calculate retum on equity (ROE) for each company for the most recent year, ROE is a measure of the company's return for investors. Return on (common stockholders) equity is discased on page 504 in your text. This should be presented as a percentage ochtwo decimal places such as 10.25% Step 5: Prepare your financial report in Word. a) First, introduce your companies and their industry or sector. Explain why you chose the companies that you did. b) In the body of your paper, one by one, discuss each item, what it means, and describe how each of your companies performed regarding that measure. The financial items may be discussed in the same order as listed. Reference cach companies' actual ratio or analysis tool result. For the vertical and horizontal analyses, discuss the items you believe to be significant. c) Once all cight calculations and financial measures and the companies' results have been discussed, determine which company would be a better investment and why using the results of your analysis. Your reasoning does not have to be limited to the financial information discussed in your report You may address other financial or non-financial factors. However, you must include discussion of the eight measures. d) Format of your report: Provide a cover page for your report that includes your name and the names of the companies you chose to analyze. Prepare the body of your report in Times New Roman 14 font (like this document), Use single-spacing with one-inch margins. You may use any font you wish to prepare the table within your report. When completed, your cover page and report must be in one Word file c) References: I expect you to locate the information in each company's 10K, 50 "Googled" answers are not acceptable and will result in a zero grade. In the introduction to your report, indicate the URL for each 10-K you utilized Submit your report as an Excel document and a Word document in Black Board I Update *** Apps MGT 419-101 Exa... https://platform.vi... Successful Writin... New Arrivals Inline Viewer x Inline XBRL HTML Form is over 7.5MB, performance may be affected. Tesla, Inc. Consolidated Balance Sheets (in millions, except per share data) December 31, 2021 December 31, 2020 $ 19,384 Assets Current assets Cash and cash equivalents Short-term marketable securities Accounts receivable, net Inventory Prepaid expenses and other current assets Total current assets Operating lease vehicles, net Solar energy systems, net Property, plant and equipment, net Operating lease right-of-use assets Digital assets, net Intangible assets, net Goodwill Other non-current assets Total assets Liabilities Current liabilities Accounts payable Accrued liabilities and other Deferred revenue Customer deposits Current portion of debt and finance leases 17,576 131 1,913 5,757 1,723 27.100 4,511 5,765 18.884 2,016 1,260 257 200 2,138 62,131 s 1,886 4,101 1,346 26,717 3,091 5,979 12,747 1.558 313 207 1,536 52,148 10,025 5,719 1,447 925 1,589 6,051 3,855 1,458 752 2,13 U Inline Viewer TVVL UVJI 3,855 1,458 752 2,132 14,248 9,556 1,284 3,330 28,418 568 604 Inline XBRL HTML Form is over 7.5MB, performance may be affected. vv Accrued liabilities and other 5,719 Deferred revenue 1,447 Customer deposits 925 Current portion of debt and finance Icases 1,589 Total current liabilities 19,705 Debt and finance leases, net of current portion 5,245 Deferred revenue, net of current portion 2,052 Other long-term liabilities 3,546 Total liabilities 30,548 Commitments and contingencies (Note 15) Redeemable noncontrolling interests in subsidiaries Convertible senior notes (Note 11) Equity Stockholders' equity Preferred stock; $0.001 par value; 100 shares authorized; no shares issued and outstanding Common stock; $0.001 par value; 2,000 shares authorized; 1,033 and 960 shares issued and outstanding as of December 31, 2021 and December 31, 2020, respectively Additional paid-in capital 29,803 Accumulated other comprehensive income 54 Retained earnings (accumulated deficit) 331 Total stockholders' equity 30.189 Noncontrolling interests in subsidiaries Total liabilities and equity 62,131 51 III 1 27,260 363 (5,399 22.225 850 52,148 826 $ The accompanying notes are an integral part of these consolidated financial statements. 49 1 Tesla, Inc. Consolidated Statements of Operations (in millions, except per share data) Year Ended December 31, 2020 2021 2019 $ 24,604 1,580 19.358 594 1,052 869 44,125 1,465 1.642 47,232 2,789 3,802 53,823 27,236 1.994 2,306 31,536 20,821 1,531 2,226 24,578 15,939 459 Revenues Automotive sales Automotive regulatory credits Automotive leasing Total automotive revenues Energy generation and storage Services and other Total revenues Cost of revenues Automotive sales Automotive leasing Total automotive cost of revenues Energy generation and storage Services and other Total cost of revenues Gross profit Operating expenses Research and development Selling, general and administrative Restructuring and other Total operating expenses Income (loss) from operations Interest income Interest expense Other income (expense), net 32,415 978 33,393 2.918 3,906 40,217 13,606 19,696 563 20,259 1.976 2,671 24,906 16,398 1,341 2,770 20,509 4,069 6,630 2,593 4,517 1,491 3,145 1,343 2,646 149 4,138 (69 (27 7,083 6,523 56 (371 135 4,636 1,994 30 (748 (122 45 G Inline Viewer 20,509 4,069 1,343 2,646 149 4,138 (69 (371) (685 45 (665 Inline XBRL HTML Form is over 7.5MB, performance may be affected. Total cost of revenues 40,217 24,906 Gross profit 13,606 6,630 Operating expenses Research and development 2,593 1,491 Selling, general and administrative 4,517 3,145 Restructuring and other (27 Total operating expenses 7,083 4,636 Income (loss) from operations 6,523 1.994 Interest income 56 30 Interest expense (748 Other income (expense), net 135 (122 Income (loss) before income taxes 6,343 1,154 Provision for income taxes 699 292 Net income (loss) 5,644 862 Net income attributable to noncontrolling interests and 125 141 redeemable noncontrolling interests in subsidiaries Net income (loss) attributable to common 721 5,519 stockholders Net income (loss) per share of common stock attributable to common stockholders Basic 5.60 0.74 Diluted S 4.90 $ 0.64 Weighted average shares used in computing net income (loss) per share of common stock Basic 986 933 Diluted 1,129 1,083 110 (775 87 $ (862 S (0.98 $ (0.98 887 887 The accompanying notes are an integral part of these consolidated financial statements. 50 2019 (775 (28 Tesla, Inc. Consolidated Statements of Comprehensive Income (Loss) (in millions) Year Ended December 31 2021 2020 Net income (loss) S 5,644 $ 862 Other comprehensive income (loss): Foreign currency translation adjustment (308) 399 Unrealized net loss on marketable securities (1) Comprehensive income (loss) 5,335 1,261 Less: Comprehensive income attributable to noncontrolling interests and redeemable noncontrolling interests in subsidiaries 125 141 Comprehensive income (loss) attributable to common stockholders 5,210 1,120 The accompanying notes are an integral part of these consolidated financial statements. 51 (803) 87 (890 Inline XBRL HTML Form is over 7.5MB, performance may be affected. on Note 13 - Equity Incentive Plans In June 2019, we adopted the 2019 Equity Incentive Plan (the "2019 Pan"). The 2019 Phan provides for the grant of stock options, restricted stock, RSUS, Mock appreciation rights performance units and performance shares to our employees, directors and consultants. Stock options granted under the 2019 Pe may be either incentive stock options of nonstatutory stock options, Incentivestock options may only be granted to our employees, Nonstatutory stock options may be granted to our employees, directors and consultants. Generally, our stock options and RSUs vest over four years and our stock options are exercisable over a maximum period of 10 years from their grant dates. Vesting typically ferminates when the employment of Balting relationship ends. As of December 31, 2021,490 million shares were reserved and available formance under the 2019 Plan The following uble summarizes our stock option kod RSU activity for the your ended December 31, 2021 Stock Open RESES Welch Arer A AN Nuwber Average Remix trine Number Gran Opis Vaher ef RSU Bate Paler in the ini det Vw Beginning of period 146,901 5 6826 IN 5 11649 Crane $ 5 2400 Tried or leased (A) 16 A) 5 US Cucelled 5 110 (M) End of period TO 11/30 46 3 14 Veid and sove, December 31, 2021 20 HIP BNB TALE Exence and verlied December 31, 2001 (1) 72 142 596 6 ties EVO 5 5 ase from (0) Tranche 8 of the 2018 CEO Performance Awarnt, which represents 84 million stock options, was achieved in the fourth quarter of 2021 and will vestupon expected certification following the filing of this Annual Report on Form 10K The weighted average grant date fair value of RSUS granted in the years ended December 31, 2021 2020 and 20195744.00.500.51 and 56:55. respectively. The pregate release date fair value of RSU in the year ended December 31, 2021 2020 and 2019 55 70 billion, 5.1.23 billion and 5502 million, respectively The regate intrinsic value of options exercised in the years ended December 1, 2001, 2020, and 2019 was $26 billion, 5155 billion and 5237 million, respectively. During the year ended December 31, 2021, our CEO exercised all of the remaining vested option from the 2012 CEO Performance Award, which amounted to an inte value of 2145 billion ESPP Our employees are eligible to purchase our common stock through payroll deductions of up to 15% of the eligible compensation, subject to any plan lumitations. The purchase price would be 85% of the lower she fair market value on the first and let trading days of each six month offering period. During the years ended December 31, 2021, 2020 and 2019, we CEP There were 33.8 million shares available for since under the ESPP of December 31, 2021 num or ance s of ation Inline XBRL HTML Form is over 7.5MB, performance may be affected. year ended December 31, 2021, our CEO exercised all of the remaining vested options from the 2012 CEO Performance Award, which amounted to an intrinsie value of $2345 billion ESPP Our employees are eligible to purchase our common stock through payroll deductions of up to 15% of their eligible compensation, subject to any plan limitations. The purchase price would be 85% of the lower of the fair market value on the first and last trading days of each six-month offering period. During the years ended December 1, 2021 2020 and 2019, wested 0.5 million, 1.8 million and 25 million shares under the ESPP. There were 33.8 million shares available for issuance under the ESPP as of December 31, 2001 Value Assumptions We use the fair value method in recognizing stock-based compensation expense. Under the fair value method, we estimate the fair value of each stock option award with service or service and performance conditions and the ESPP on the grant date generally using the Black Scholes option pricing model The weighted average assumptions not in the Black-Schalet model for stock options are as follows: mation w etail) 2021 2019 Year Kad Deber 2030 0.26 19 Risk-free interest rate Expected term (in ycan) Expected volatility Dividend yield Grant date fair value per share of abilities 0.68% 4 59% 00% 384.07 694 24% 45 4846 00% 22.32 0.0 216.14 S 5 g Lease bles from Type The fair value of RSUs with service or service and performance conditions is measured on the grant date based on the closing fair market value of our common stock. The risk-free interest rate is based on the US Treasury yield for rero-coupon US Treasury notes with maturities approximating each grant's expected Me We use our historical data in estimating the expected term of our employees. The expected volatility is based on the wenge of the implied volantity of publicly traded options for our common stock and the historical volatility of our common stock 2015 CEO Performance Award In March 2018, our stockholden approved the Board of Direction grant of 101.3 million lock option wards, as adjusted to give effect to the five for one stockpit effected in the form of a stock dividend in August 2010 ("Stock Spli"), to our CEO (the 2018 CHO Performance Award) The 2018 CHO Performance Award consists of 12 vesting treaches with a vesting schedule bused entirely on the attainment of both operational milestones (performance conditions) od market.comin continued emolumenthers the CEO or both Executive Chairman and Chief Product Officer and service through each yestinate Ench of the 13 vestine tranches of the 2011 CTO Performance Award will certificate Board of Directors that the market caption is one for such tranche which 100 the ranch andra increments that otherlendar month ochlenderdy trailing Continence minnesota MENCAYOTG miered on bed lived for themselve alguien med bars and subsequently reported by us in our commented in termented with orm Dodor TK Adjusted EBITDA u detin de lona) talle to common stockholders before meest expense, provision (bene) for income taxes, depreciation and americation and stock based compensation. Upon vesting and exercise, including payment of the exercise price of 57001 per share our CHO must hold hares that he acquired for five years pou exercise, other than cashless exercise where shares are simultaneously Minimum red for tional ents Tags Inline XBRL HTML Form is over 7.5MB, performance may be affected. 2018 CEO Performance Award In March 2018, our stockholders approved the Board of Directors' grant of 1013 million stock option awards, as adjusted to give effect to the five-for-one stock split effected in the form of a stock dividend in August 2020 (Stock Split"), to our CEO (the 2018 CEO Performance Award'). The 2018 CEO Performance Award consists of 12 vesting tranches with a vesting Schedule based entirely on the attainment of both operational milestones (performance conditions and market conditions, assuming continued employment citer as the CEO or as both Executive Chairman and Chief Product Officer and service through each vesting date Fach of the 12 vestine tranches of the 2018 CEO Performance Award will vest upon certification by the Board of Directors that both the market capitalization milestone for such tranche, which becins at S1000 billion for the first tranche and increases by increments of $500 million thereafter Lysed on both a sex calendar month trailing averade and 30 calendar day trailing average, counting only trading days has been achieved and any one of Che following it operational mestones focused on total revenue or any one of the cight operational milestones focused on Adjusted EBITDA have been achieved for the four consecutive fiscal quarters on analized basis and subsequently reported by us in our consolidated financial statements filed with our Forms 10-0 and/or 10-K. Adjusted EBITDA is defined as net income (los) attributable to common stockholders before interest expense, provision (benefit) for income taxes, depreciation and amortization and stock based compensation. Upon vesting and exercise, including the payment of the exercise price of $70.01 per share our CEO mast hold shares that he acquires for five years post-exercise, other than a cashless exercise where shares are simultaneously sold to pay for the exercise price and any required tax withholding The achievement status of the operational milestones as of December 31, 2021 is provided below. Although an operational milestone is deemed achieved in the last quarter of the relevant analized period, it may be certified only after the financial statements supporting it achievement have been filed with our Form 10-Q and/or 10-K Total Annused R Annual Adjusted EBITDA Milestone Milena Achievement State (to Dom Are State $ 20.0 Achieved 5 1.5 Achieved 5 350 Achieved $ 3.0 Achieved 350 5 Probable 45 $ Achieved 75.0 Probable 5 6.0 Achieved 100,0 S 80 Achieved 1250 5 10.0 Achieved 0 1500 120 $ $ Probable 14.0 S Probable 175.0 (1) Achieved in the fourth quarter of 2021 and expected to be certified following the filing of this Annual Report on Form 10-K Stock-based compensation under the 2018 CEO Performance Award represents a non-cash expense and is recorded as Selling general, and administrative operating expense in our consolidated statement of operations. In each quarter since the grant of the 2018 CEO Performance Award, we have recognized expense, generally on a pro-rated basis for only the sumber of tranches (up to the maximum of 12 tranches) that corresponds to the number of operational milestones that have been achieved or have been determined probable of being achieved in the future, in accordance with the following principles 83 ISISSISSIT ACC 215 Financial Report 150 Point Assignment! Step 1: Select your companies. You may pick any two companies - examples are included at the end of this assignment. However, they must be from the same industry! Use the SIC as your guide to the industry not your intuition. Step 2: Locate and download (optional) your companies' form 10-K. The 10-K is an annual filing required by the Securities and Exchange Commission of all U.S. publicly traded companies. Among other things, the 10-K includes a public company's financial statements under Item 8 in the table of contents. They are available at sec gov. We will have a class session that walks you through locating form 10-K. WARNING: 10-K's may be HUNDREDS of pages long. You will only need to print a few selected pages from each item. Be careful before you hit "Print" Step 3: You will need the income statements and balance sheets for each of your companies for the most recent years available. Enter the income statements and balance sheets for your companies in an Excel spreadshoct. Use a separate worksheet for each company but only one workbook. Step 4: Complete the following financial analysis tools with each clearly labeled as noted below in your Excel document: 1. Perform a vertical analysis of each company for both years. The process for doing this will be discussed in class. 2. Perform a horizontal analysis of each company for the most recent year, The process for doing this will be discussed in class. 3. Obtain camnings per share (EPS) - EPS is the amount of net income eamed per share of the company's common stock. You will not have to calculate EPS figures because they are provided at the end of the company's income statement. Use the figures identified as "Basic EPS" for all operations. Calculate the price earnings (PE) ratio for the most recent two years. To do this, go to Google Finance and search for historical stock prices for your company. Use the closing date for the company (such as December 31, 2020) if the closing date is not a day when markets are open, use the first day available before the closing date. The information on calculating and analyzing the PE ratio is on page 426 and 504 of your text. 4. Current ratio - Calculate the current ratio for each company for both years. Focus day available before the closing date. The information on calculating and analyzing the PE ratio is on page 426 and 504 of your text. 4. Current ratio - Calculate the current ratio for each company for both years. The current ratio measures a company's liquidity. It is a proportion of current assets to current liabilities. Your book offers information about the current ratio on page 109 as well as on page 500. As is shown on page 109, be sure to provide the results of your calculations to two places after the decimal point. This is not a percentage S. Calculate the acid-test ratio for each company for both years. Similar to the current ratio, the acid test ratio also measures a company's liquidity. The ratio is discussed on page 158 in your text. This is not a percentage and should be expressed two places after the decimal place. On page 159, the answer for the current year for Nike would be 1.80. 6. Calculate the debt ratio for each company for each year. The debt ratio reflects a company's ability to meet its long-term obligations. Details about this ratio are provided on Page 63. NOTE: The example shows a result of 60 for the current year. That figure is really a percentage and should be reported with two places after the decimal point (69.51%). Be sure to report your debt ratio results in this format, 7. Calculate return on assets (ROA) for each company for the most recent year. ROA is a measure of how well a company uses its assets to produce profit. This ratio is discussed on Page 19 of your text. Again, be sure to report your results to two places after the decimal point. The result of the calculation shown on Page 19 is 18.99% 8. Calculate retum on equity (ROE) for each company for the most recent year, ROE is a measure of the company's return for investors. Return on (common stockholders) equity is discased on page 504 in your text. This should be presented as a percentage ochtwo decimal places such as 10.25% Step 5: Prepare your financial report in Word. a) First, introduce your companies and their industry or sector. Explain why you chose the companies that you did. b) In the body of your paper, one by one, discuss each item, what it means, and describe how each of your companies performed regarding that measure. The financial items may be discussed in the same order as listed. Reference cach companies' actual ratio or analysis tool result. For the vertical and horizontal analyses, discuss the items you believe to be significant. c) Once all cight calculations and financial measures and the companies' results have been discussed, determine which company would be a better investment and why using the results of your analysis. Your reasoning does not have to be limited to the financial information discussed in your report You may address other financial or non-financial factors. However, you must include discussion of the eight measures. d) Format of your report: Provide a cover page for your report that includes your name and the names of the companies you chose to analyze. Prepare the body of your report in Times New Roman 14 font (like this document), Use single-spacing with one-inch margins. You may use any font you wish to prepare the table within your report. When completed, your cover page and report must be in one Word file c) References: I expect you to locate the information in each company's 10K, 50 "Googled" answers are not acceptable and will result in a zero grade. In the introduction to your report, indicate the URL for each 10-K you utilized Submit your report as an Excel document and a Word document in Black Board I Update *** Apps MGT 419-101 Exa... https://platform.vi... Successful Writin... New Arrivals Inline Viewer x Inline XBRL HTML Form is over 7.5MB, performance may be affected. Tesla, Inc. Consolidated Balance Sheets (in millions, except per share data) December 31, 2021 December 31, 2020 $ 19,384 Assets Current assets Cash and cash equivalents Short-term marketable securities Accounts receivable, net Inventory Prepaid expenses and other current assets Total current assets Operating lease vehicles, net Solar energy systems, net Property, plant and equipment, net Operating lease right-of-use assets Digital assets, net Intangible assets, net Goodwill Other non-current assets Total assets Liabilities Current liabilities Accounts payable Accrued liabilities and other Deferred revenue Customer deposits Current portion of debt and finance leases 17,576 131 1,913 5,757 1,723 27.100 4,511 5,765 18.884 2,016 1,260 257 200 2,138 62,131 s 1,886 4,101 1,346 26,717 3,091 5,979 12,747 1.558 313 207 1,536 52,148 10,025 5,719 1,447 925 1,589 6,051 3,855 1,458 752 2,13 U Inline Viewer TVVL UVJI 3,855 1,458 752 2,132 14,248 9,556 1,284 3,330 28,418 568 604 Inline XBRL HTML Form is over 7.5MB, performance may be affected. vv Accrued liabilities and other 5,719 Deferred revenue 1,447 Customer deposits 925 Current portion of debt and finance Icases 1,589 Total current liabilities 19,705 Debt and finance leases, net of current portion 5,245 Deferred revenue, net of current portion 2,052 Other long-term liabilities 3,546 Total liabilities 30,548 Commitments and contingencies (Note 15) Redeemable noncontrolling interests in subsidiaries Convertible senior notes (Note 11) Equity Stockholders' equity Preferred stock; $0.001 par value; 100 shares authorized; no shares issued and outstanding Common stock; $0.001 par value; 2,000 shares authorized; 1,033 and 960 shares issued and outstanding as of December 31, 2021 and December 31, 2020, respectively Additional paid-in capital 29,803 Accumulated other comprehensive income 54 Retained earnings (accumulated deficit) 331 Total stockholders' equity 30.189 Noncontrolling interests in subsidiaries Total liabilities and equity 62,131 51 III 1 27,260 363 (5,399 22.225 850 52,148 826 $ The accompanying notes are an integral part of these consolidated financial statements. 49 1 Tesla, Inc. Consolidated Statements of Operations (in millions, except per share data) Year Ended December 31, 2020 2021 2019 $ 24,604 1,580 19.358 594 1,052 869 44,125 1,465 1.642 47,232 2,789 3,802 53,823 27,236 1.994 2,306 31,536 20,821 1,531 2,226 24,578 15,939 459 Revenues Automotive sales Automotive regulatory credits Automotive leasing Total automotive revenues Energy generation and storage Services and other Total revenues Cost of revenues Automotive sales Automotive leasing Total automotive cost of revenues Energy generation and storage Services and other Total cost of revenues Gross profit Operating expenses Research and development Selling, general and administrative Restructuring and other Total operating expenses Income (loss) from operations Interest income Interest expense Other income (expense), net 32,415 978 33,393 2.918 3,906 40,217 13,606 19,696 563 20,259 1.976 2,671 24,906 16,398 1,341 2,770 20,509 4,069 6,630 2,593 4,517 1,491 3,145 1,343 2,646 149 4,138 (69 (27 7,083 6,523 56 (371 135 4,636 1,994 30 (748 (122 45 G Inline Viewer 20,509 4,069 1,343 2,646 149 4,138 (69 (371) (685 45 (665 Inline XBRL HTML Form is over 7.5MB, performance may be affected. Total cost of revenues 40,217 24,906 Gross profit 13,606 6,630 Operating expenses Research and development 2,593 1,491 Selling, general and administrative 4,517 3,145 Restructuring and other (27 Total operating expenses 7,083 4,636 Income (loss) from operations 6,523 1.994 Interest income 56 30 Interest expense (748 Other income (expense), net 135 (122 Income (loss) before income taxes 6,343 1,154 Provision for income taxes 699 292 Net income (loss) 5,644 862 Net income attributable to noncontrolling interests and 125 141 redeemable noncontrolling interests in subsidiaries Net income (loss) attributable to common 721 5,519 stockholders Net income (loss) per share of common stock attributable to common stockholders Basic 5.60 0.74 Diluted S 4.90 $ 0.64 Weighted average shares used in computing net income (loss) per share of common stock Basic 986 933 Diluted 1,129 1,083 110 (775 87 $ (862 S (0.98 $ (0.98 887 887 The accompanying notes are an integral part of these consolidated financial statements. 50 2019 (775 (28 Tesla, Inc. Consolidated Statements of Comprehensive Income (Loss) (in millions) Year Ended December 31 2021 2020 Net income (loss) S 5,644 $ 862 Other comprehensive income (loss): Foreign currency translation adjustment (308) 399 Unrealized net loss on marketable securities (1) Comprehensive income (loss) 5,335 1,261 Less: Comprehensive income attributable to noncontrolling interests and redeemable noncontrolling interests in subsidiaries 125 141 Comprehensive income (loss) attributable to common stockholders 5,210 1,120 The accompanying notes are an integral part of these consolidated financial statements. 51 (803) 87 (890 Inline XBRL HTML Form is over 7.5MB, performance may be affected. on Note 13 - Equity Incentive Plans In June 2019, we adopted the 2019 Equity Incentive Plan (the "2019 Pan"). The 2019 Phan provides for the grant of stock options, restricted stock, RSUS, Mock appreciation rights performance units and performance shares to our employees, directors and consultants. Stock options granted under the 2019 Pe may be either incentive stock options of nonstatutory stock options, Incentivestock options may only be granted to our employees, Nonstatutory stock options may be granted to our employees, directors and consultants. Generally, our stock options and RSUs vest over four years and our stock options are exercisable over a maximum period of 10 years from their grant dates. Vesting typically ferminates when the employment of Balting relationship ends. As of December 31, 2021,490 million shares were reserved and available formance under the 2019 Plan The following uble summarizes our stock option kod RSU activity for the your ended December 31, 2021 Stock Open RESES Welch Arer A AN Nuwber Average Remix trine Number Gran Opis Vaher ef RSU Bate Paler in the ini det Vw Beginning of period 146,901 5 6826 IN 5 11649 Crane $ 5 2400 Tried or leased (A) 16 A) 5 US Cucelled 5 110 (M) End of period TO 11/30 46 3 14 Veid and sove, December 31, 2021 20 HIP BNB TALE Exence and verlied December 31, 2001 (1) 72 142 596 6 ties EVO 5 5 ase from (0) Tranche 8 of the 2018 CEO Performance Awarnt, which represents 84 million stock options, was achieved in the fourth quarter of 2021 and will vestupon expected certification following the filing of this Annual Report on Form 10K The weighted average grant date fair value of RSUS granted in the years ended December 31, 2021 2020 and 20195744.00.500.51 and 56:55. respectively. The pregate release date fair value of RSU in the year ended December 31, 2021 2020 and 2019 55 70 billion, 5.1.23 billion and 5502 million, respectively The regate intrinsic value of options exercised in the years ended December 1, 2001, 2020, and 2019 was $26 billion, 5155 billion and 5237 million, respectively. During the year ended December 31, 2021, our CEO exercised all of the remaining vested option from the 2012 CEO Performance Award, which amounted to an inte value of 2145 billion ESPP Our employees are eligible to purchase our common stock through payroll deductions of up to 15% of the eligible compensation, subject to any plan lumitations. The purchase price would be 85% of the lower she fair market value on the first and let trading days of each six month offering period. During the years ended December 31, 2021, 2020 and 2019, we CEP There were 33.8 million shares available for since under the ESPP of December 31, 2021 num or ance s of ation Inline XBRL HTML Form is over 7.5MB, performance may be affected. year ended December 31, 2021, our CEO exercised all of the remaining vested options from the 2012 CEO Performance Award, which amounted to an intrinsie value of $2345 billion ESPP Our employees are eligible to purchase our common stock through payroll deductions of up to 15% of their eligible compensation, subject to any plan limitations. The purchase price would be 85% of the lower of the fair market value on the first and last trading days of each six-month offering period. During the years ended December 1, 2021 2020 and 2019, wested 0.5 million, 1.8 million and 25 million shares under the ESPP. There were 33.8 million shares available for issuance under the ESPP as of December 31, 2001 Value Assumptions We use the fair value method in recognizing stock-based compensation expense. Under the fair value method, we estimate the fair value of each stock option award with service or service and performance conditions and the ESPP on the grant date generally using the Black Scholes option pricing model The weighted average assumptions not in the Black-Schalet model for stock options are as follows: mation w etail) 2021 2019 Year Kad Deber 2030 0.26 19 Risk-free interest rate Expected term (in ycan) Expected volatility Dividend yield Grant date fair value per share of abilities 0.68% 4 59% 00% 384.07 694 24% 45 4846 00% 22.32 0.0 216.14 S 5 g Lease bles from Type The fair value of RSUs with service or service and performance conditions is measured on the grant date based on the closing fair market value of our common stock. The risk-free interest rate is based on the US Treasury yield for rero-coupon US Treasury notes with maturities approximating each grant's expected Me We use our historical data in estimating the expected term of our employees. The expected volatility is based on the wenge of the implied volantity of publicly traded options for our common stock and the historical volatility of our common stock 2015 CEO Performance Award In March 2018, our stockholden approved the Board of Direction grant of 101.3 million lock option wards, as adjusted to give effect to the five for one stockpit effected in the form of a stock dividend in August 2010 ("Stock Spli"), to our CEO (the 2018 CHO Performance Award) The 2018 CHO Performance Award consists of 12 vesting treaches with a vesting schedule bused entirely on the attainment of both operational milestones (performance conditions) od market.comin continued emolumenthers the CEO or both Executive Chairman and Chief Product Officer and service through each yestinate Ench of the 13 vestine tranches of the 2011 CTO Performance Award will certificate Board of Directors that the market caption is one for such tranche which 100 the ranch andra increments that otherlendar month ochlenderdy trailing Continence minnesota MENCAYOTG miered on bed lived for themselve alguien med bars and subsequently reported by us in our commented in termented with orm Dodor TK Adjusted EBITDA u detin de lona) talle to common stockholders before meest expense, provision (bene) for income taxes, depreciation and americation and stock based compensation. Upon vesting and exercise, including payment of the exercise price of 57001 per share our CHO must hold hares that he acquired for five years pou exercise, other than cashless exercise where shares are simultaneously Minimum red for tional ents Tags Inline XBRL HTML Form is over 7.5MB, performance may be affected. 2018 CEO Performance Award In March 2018, our stockholders approved the Board of Directors' grant of 1013 million stock option awards, as adjusted to give effect to the five-for-one stock split effected in the form of a stock dividend in August 2020 (Stock Split"), to our CEO (the 2018 CEO Performance Award'). The 2018 CEO Performance Award consists of 12 vesting tranches with a vesting Schedule based entirely on the attainment of both operational milestones (performance conditions and market conditions, assuming continued employment citer as the CEO or as both Executive Chairman and Chief Product Officer and service through each vesting date Fach of the 12 vestine tranches of the 2018 CEO Performance Award will vest upon certification by the Board of Directors that both the market capitalization milestone for such tranche, which becins at S1000 billion for the first tranche and increases by increments of $500 million thereafter Lysed on both a sex calendar month trailing averade and 30 calendar day trailing average, counting only trading days has been achieved and any one of Che following it operational mestones focused on total revenue or any one of the cight operational milestones focused on Adjusted EBITDA have been achieved for the four consecutive fiscal quarters on analized basis and subsequently reported by us in our consolidated financial statements filed with our Forms 10-0 and/or 10-K. Adjusted EBITDA is defined as net income (los) attributable to common stockholders before interest expense, provision (benefit) for income taxes, depreciation and amortization and stock based compensation. Upon vesting and exercise, including the payment of the exercise price of $70.01 per share our CEO mast hold shares that he acquires for five years post-exercise, other than a cashless exercise where shares are simultaneously sold to pay for the exercise price and any required tax withholding The achievement status of the operational milestones as of December 31, 2021 is provided below. Although an operational milestone is deemed achieved in the last quarter of the relevant analized period, it may be certified only after the financial statements supporting it achievement have been filed with our Form 10-Q and/or 10-K Total Annused R Annual Adjusted EBITDA Milestone Milena Achievement State (to Dom Are State $ 20.0 Achieved 5 1.5 Achieved 5 350 Achieved $ 3.0 Achieved 350 5 Probable 45 $ Achieved 75.0 Probable 5 6.0 Achieved 100,0 S 80 Achieved 1250 5 10.0 Achieved 0 1500 120 $ $ Probable 14.0 S Probable 175.0 (1) Achieved in the fourth quarter of 2021 and expected to be certified following the filing of this Annual Report on Form 10-K Stock-based compensation under the 2018 CEO Performance Award represents a non-cash expense and is recorded as Selling general, and administrative operating expense in our consolidated statement of operations. In each quarter since the grant of the 2018 CEO Performance Award, we have recognized expense, generally on a pro-rated basis for only the sumber of tranches (up to the maximum of 12 tranches) that corresponds to the number of operational milestones that have been achieved or have been determined probable of being achieved in the future, in accordance with the following principles 83 ISISSISSIT
Step by Step Solution
There are 3 Steps involved in it

Get step-by-step solutions from verified subject matter experts