

Question: Comparative figures for Apple and Google follow. Apple Google One Year TWO Years 5 millions Current Year Current One Year TWO Years Prior Prior Inventory
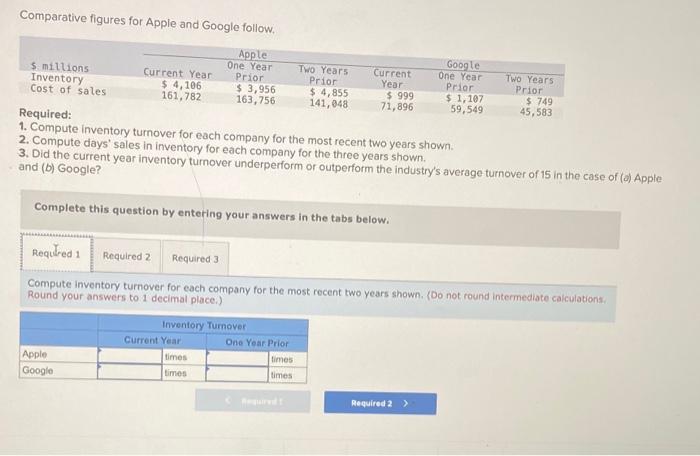
Comparative figures for Apple and Google follow. Apple Google One Year TWO Years 5 millions Current Year Current One Year TWO Years Prior Prior Inventory Year Prior Prior $ 4,106 Cost of sales $ 3,956 $ 4,855 $ 999 $ 1,107 161,782 $ 749 163,756 141,048 71,896 59,549 45,583 Required: 1. Compute inventory turnover for each company for the most recent two years shown 2. Compute days' sales in inventory for each company for the three years shown 3. Did the current year inventory turnover underperform or outperform the industry's average turnover of 15 in the case of (o) Apple and (b) Google? Complete this question by entering your answers in the tabs below. Required 1 Required 2 Required 3 Compute Inventory turnover for each company for the most recent two years shown. (Do not round intermediate calculations Round your answers to 1 decimal place.) Inventory Turnover Current Year One Year Prior Apple times times Google times times THE Required 2 >
Step by Step Solution
There are 3 Steps involved in it

Get step-by-step solutions from verified subject matter experts