

Question: Comparative figures for Apple and Google follow. $ millions Apple Google Current Year One Year Prior Two Years Prior Current Year One Year Prior Two
Comparative figures for Apple and Google follow.
| $ millions | Apple | |||||
|---|---|---|---|---|---|---|
| Current Year | One Year Prior | Two Years Prior | Current Year | One Year Prior | Two Years Prior | |
| Inventory | $ 4,106 | $ 3,956 | $ 4,855 | $ 999 | $ 1,107 | $ 749 |
| Cost of goods sold | 161,782 | 163,756 | 141,048 | 71,896 | 59,549 | 45,583 |
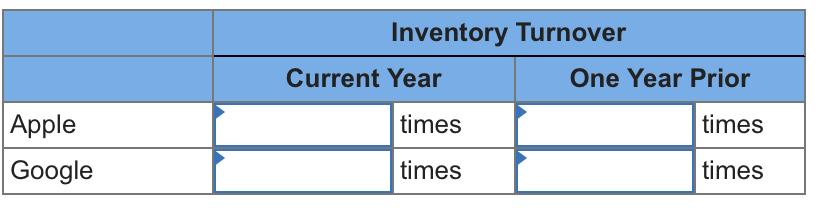
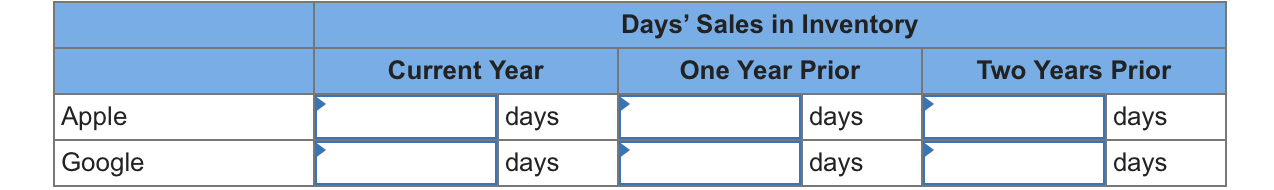
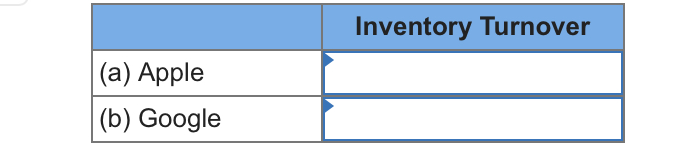
Required: 1. Compute inventory turnover for each company for the most recent two years shown. 2. Compute days sales in inventory for each company for the three years shown. 3. Did the current year inventory turnover underperform or outperform the industry's average turnover of 15 in the case of (a) Apple and (b) Google?
\begin{tabular}{|c|c|c|} \hline & \multicolumn{2}{|c|}{ Inventory Turnover } \\ \hline & Current Year & One Year Prior \\ \hline Apple & times & times \\ \hline Google & times & times \\ \hline \end{tabular} \begin{tabular}{|c|c|c|c|} \hline \multirow[b]{3}{*}{ Apple } & \multicolumn{3}{|c|}{ Days' Sales in Inventory } \\ \hline & Year & One Year Prior & Two Years Prior \\ \hline & days & days & days \\ \hline Google & days & days & days \\ \hline \end{tabular} \begin{tabular}{|l|l|} \hline & \multicolumn{1}{|c|}{ Inventory Turnover } \\ \hline (a) Apple & \\ \hline (b) Google & \\ \hline \end{tabular}
Step by Step Solution
There are 3 Steps involved in it

Get step-by-step solutions from verified subject matter experts