

Question: I need help with these exact numbers pls! AppleComparative figures for Apple and Google follow. $ millions Apple Google Current Year One Year Prior Two
I need help with these exact numbers pls!
AppleComparative figures for Apple and Google follow.
| $ millions | Apple | |||||
|---|---|---|---|---|---|---|
| Current Year | One Year Prior | Two Years Prior | Current Year | One Year Prior | Two Years Prior | |
| Total assets | $ 365,725 | $ 375,319 | $ 321,686 | $ 232,792 | $ 197,295 | $ 167,497 |
| Net sales | 265,595 | 229,234 | 215,639 | 136,819 | 110,855 | 90,272 |
Required:
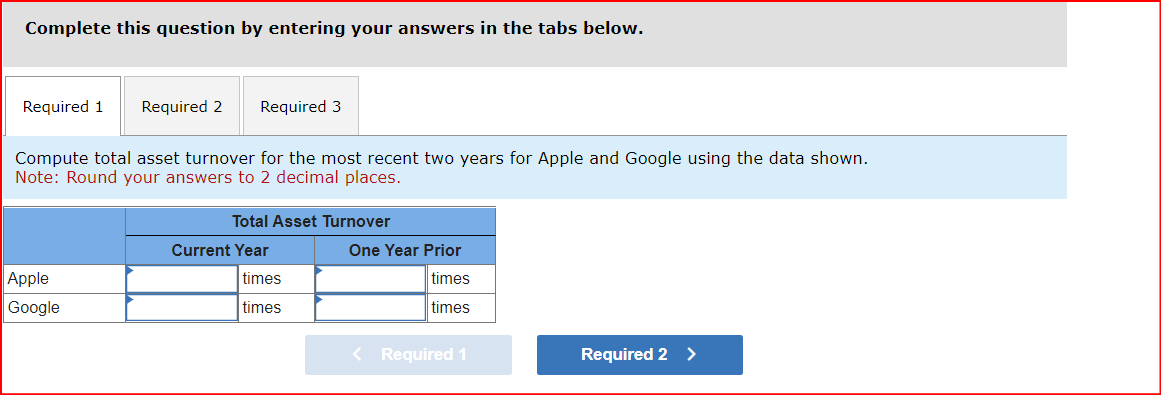
- Compute total asset turnover for the most recent two years for Apple and Google using the data shown.
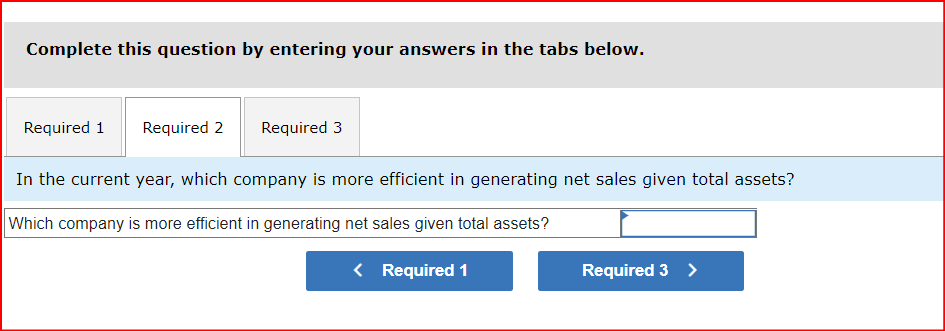
- In the current year, which company is more efficient in generating net sales given total assets?
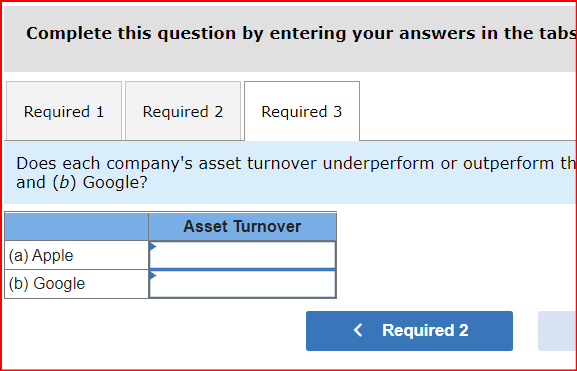
- Does each company's asset turnover underperform or outperform the industry (assumed) asset turnover of 0.5 for: (a) Apple and (b) Google?
Complete this question by entering your answers in the tabs Required 1 Required 2 Required 3 Does each company's asset turnover underperform or outperform th and (b) Google? (a) Apple (b) Google Asset Turnover Complete this question by entering your answers in the tabs below. Required 1 Required 2 Required 3 Compute total asset turnover for the most recent two years for Apple and Google using the data shown. Note: Round your answers to 2 decimal places. Apple Google Total Asset Turnover Current Year times times One Year Prior times times
Step by Step Solution
There are 3 Steps involved in it

Get step-by-step solutions from verified subject matter experts