

Question: Comparative financial statement data for Blossom Ltd. and Crane Ltd., two competitors, follow: Net sales Cost of goods sold Operating expenses Interest expense Income
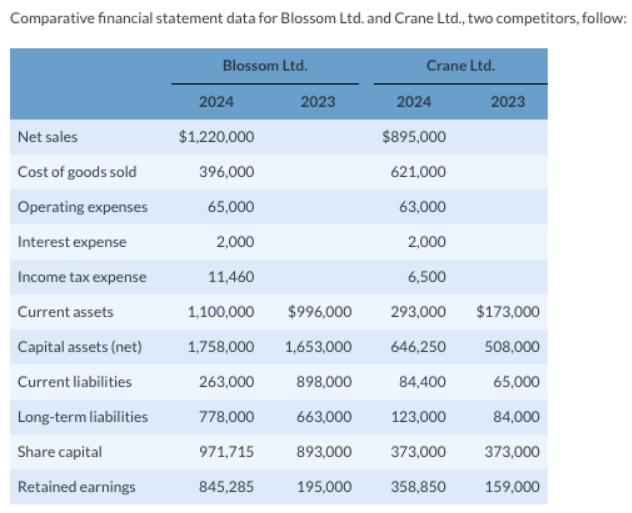

Comparative financial statement data for Blossom Ltd. and Crane Ltd., two competitors, follow: Net sales Cost of goods sold Operating expenses Interest expense Income tax expense Current assets Capital assets (net) Current liabilities Long-term liabilities Share capital Retained earnings Blossom Ltd. 2024 $1,220,000 396,000 65,000 2023 2,000 11,460 1,100,000 $996,000 1,758,000 1,653,000 263,000 898,000 778,000 663,000 971,715 893,000 845,285 195,000 Crane Ltd. 2024 $895,000 621,000 63,000 2,000 6,500 293,000 $173,000 646,250 508,000 84,400 65,000 123,000 84,000 373,000 373,000 358,850 159,000 2023 Prepare a common-size analysis of the 2024 statement of income data for Blossom Ltd. and Crane Ltd. (Round percentage answers to 1 decimal place, e.g. 15.1%.)
Step by Step Solution
3.43 Rating (162 Votes )
There are 3 Steps involved in it
The answer provided below has been developed in a clear step by step manner Step 1 Vertical analysis ... View full answer

Get step-by-step solutions from verified subject matter experts