

Question: Comparative financial statement data for Novak Corp. and Martinez Corp., two competitors, appear below. are as of December 31, 2022. Net sales Cost of goods
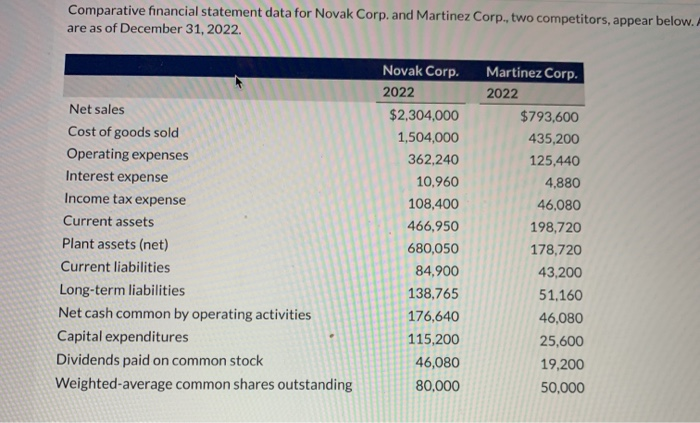
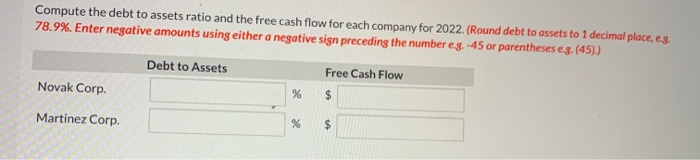
Comparative financial statement data for Novak Corp. and Martinez Corp., two competitors, appear below. are as of December 31, 2022. Net sales Cost of goods sold Operating expenses Interest expense Income tax expense Current assets Plant assets (net) Current liabilities Long-term liabilities Net cash common by operating activities Capital expenditures Dividends paid on common stock Weighted average common shares outstanding Novak Corp. 2022 $2,304,000 1,504,000 362,240 10,960 108,400 466,950 680,050 84,900 138,765 176,640 115,200 46,080 80,000 Martinez Corp. 2022 $793,600 435,200 125,440 4,880 46,080 198,720 178,720 43,200 51,160 46,080 25,600 19,200 50.000 Compute the debt to assets ratio and the free cash flow for each company for 2022. (Round debt to assets to 1 decimal place, e.g. 78.9%. Enter negative amounts using either a negative sign preceding the number e.g. -45 or parentheses e.g. (45).) Debt to Assets Free Cash Flow Novak Corp. % $ Martinez Corp. % $
Step by Step Solution
There are 3 Steps involved in it

Get step-by-step solutions from verified subject matter experts