

Question: Comparative income statement data for Crane Inc. and Blue Ltd., two competitors, are shown below for the year ended December 31, 2021. Net sales Cost
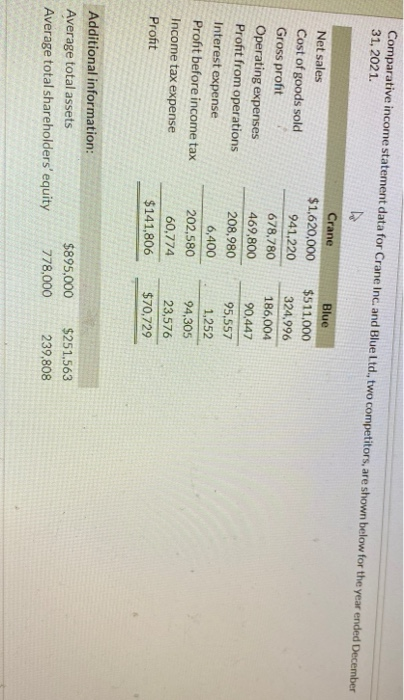
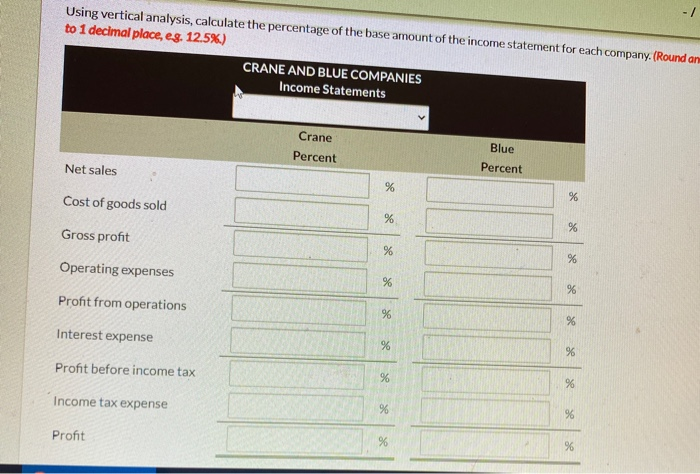
Comparative income statement data for Crane Inc. and Blue Ltd., two competitors, are shown below for the year ended December 31, 2021. Net sales Cost of goods sold Gross profit Operating expenses Profit from operations Interest expense Profit before income tax Income tax expense Profit Crane $1,620,000 941,220 678,780 469,800 208,980 6,400 202,580 60,774 $141,806 Blue $511,000 324.996 186,004 90,447 95,557 1.252 94,305 23,576 $70,729 Additional information: Average total assets Average total shareholders' equity $895,000 778,000 $251,563 239,808 Using vertical analysis, calculate the percentage of the base amount of the income statement for each company. (Round an to 1 decimal place, e g. 12.5%) CRANE AND BLUE COMPANIES Income Statements Crane Percent Blue Percent Net sales % Cost of goods sold % % % Gross profit % Operating expenses % % se Profit from operations % % Interest expense % %6 Profit before income tax % % Income tax expense % % Profit %
Step by Step Solution
There are 3 Steps involved in it

Get step-by-step solutions from verified subject matter experts