

Question: Comparative income statement data for Crane Inc and Pronghorn Ltd., two competitors, are shown below for the year ended December 31, 2021. Net sales Cost
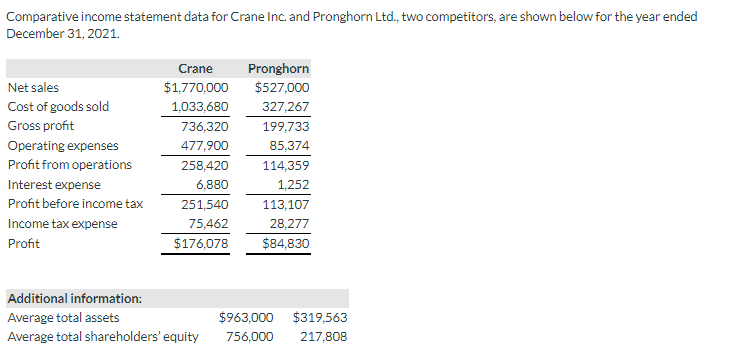
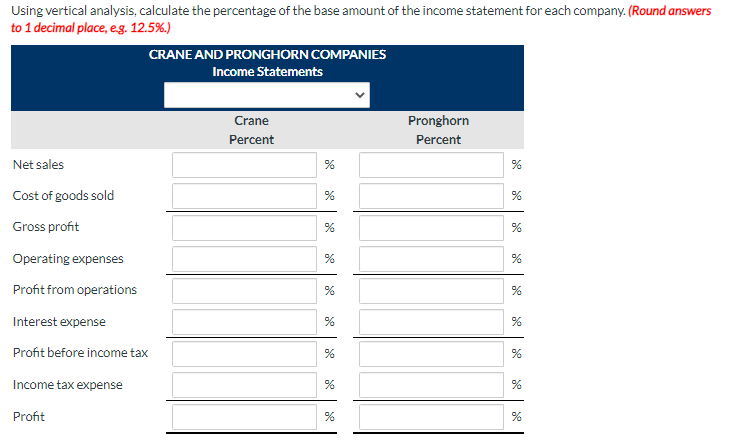
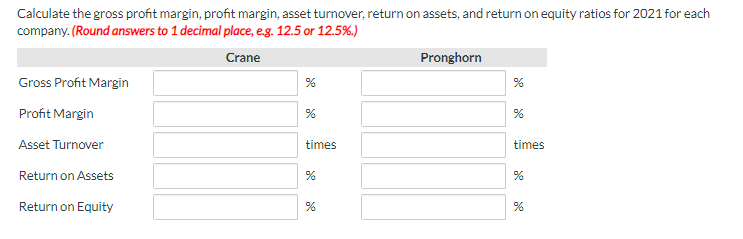
Comparative income statement data for Crane Inc and Pronghorn Ltd., two competitors, are shown below for the year ended December 31, 2021. Net sales Cost of goods sold Gross profit Operating expenses Profit from operations Interest expense Profit before income tax Income tax expense Profit Crane $1,770,000 1,033,680 736,320 477,900 258,420 6,880 251.540 75,462 $176,078 Pronghorn $527,000 327,267 199,733 85,374 114,359 1.252 113.107 28,277 $84.830 Additional information: Average total assets Average total shareholders' equity $963,000 756,000 $319,563 217,808 Using vertical analysis, calculate the percentage of the base amount of the income statement for each company. (Round answers to 1 decimal place, e.g. 12.5%.) CRANE AND PRONGHORN COMPANIES Income Statements Crane Percent Pronghorn Percent Net sales Cost of goods sold % % Gross profit % Operating expenses % % % % Profit from operations Interest expense % % Profit before income tax % Income tax expense % % Profit % % Calculate the gross profit margin, profit margin, asset turnover, return on assets, and return on equity ratios for 2021 for each company. (Round answers to 1 decimal place, e.g. 12.5 or 12.5%.) Pronghorn Gross Profit Margin % Crane Profit Margin % Asset Turnover times times Return on Assets % Return on Equity % %
Step by Step Solution
There are 3 Steps involved in it

Get step-by-step solutions from verified subject matter experts