

Question: Comparative income statement data for Cullumber Inc. and Bramble Ltd., two competitors, are shown below for the year ended December 31, 2021 Net sales Cost
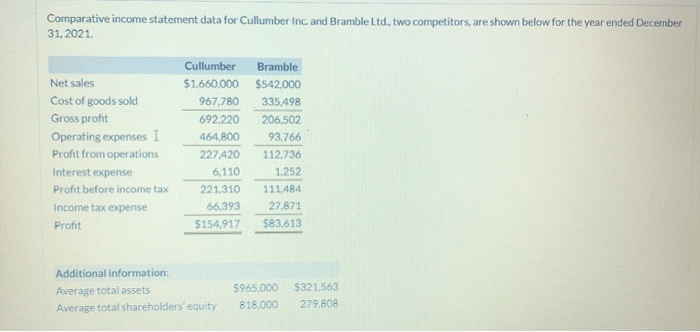
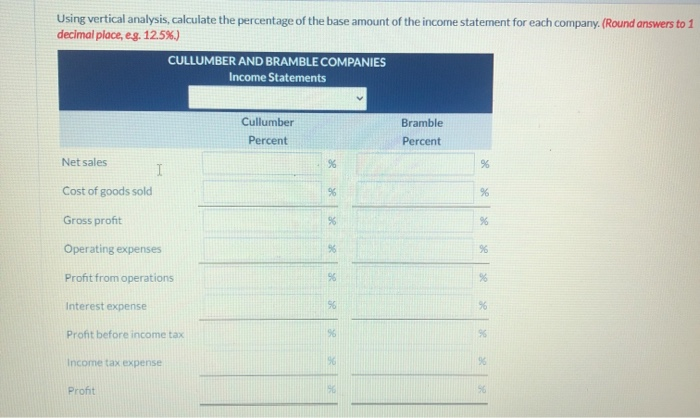
Comparative income statement data for Cullumber Inc. and Bramble Ltd., two competitors, are shown below for the year ended December 31, 2021 Net sales Cost of goods sold Gross profit Operating expenses 1 Profit from operations Interest expense Profit before income tax Income tax expense Profit Cullumber $1,660,000 967,780 692.220 464,800 227.420 6,110 221,310 66,393 $154,917 Bramble $542.000 335.498 206,502 93.766 112.736 1.252 111.484 27.871 $83.613 Additional information: Average total assets Average total shareholders' equity $965.000 818.000 $321,563 279.808 Using vertical analysis, calculate the percentage of the base amount of the income statement for each company. (Round answers to 1 decimal place, eg. 12.5%) CULLUMBER AND BRAMBLE COMPANIES Income Statements Bramble Cullumber Percent Percent Net sales %6 1 % Cost of goods sold % % Gross profit 32 %6 Operating expenses 96 % Profit from operations 90 Interest expense 90 SR Profit before income tax 9 Income tax expense 90 Profit 90 90
Step by Step Solution
There are 3 Steps involved in it

Get step-by-step solutions from verified subject matter experts