

Question: Comparative income statement data for Sandhill Inc. and Indigo Ltd., two competitors, are shown below for the year ended December 31, 2021. Net sales Cost
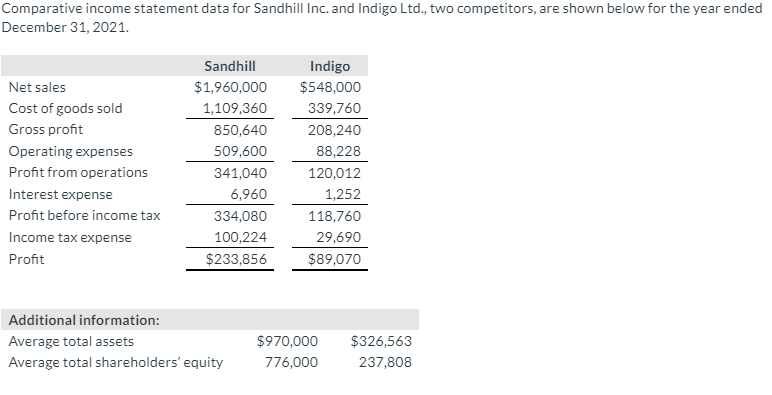
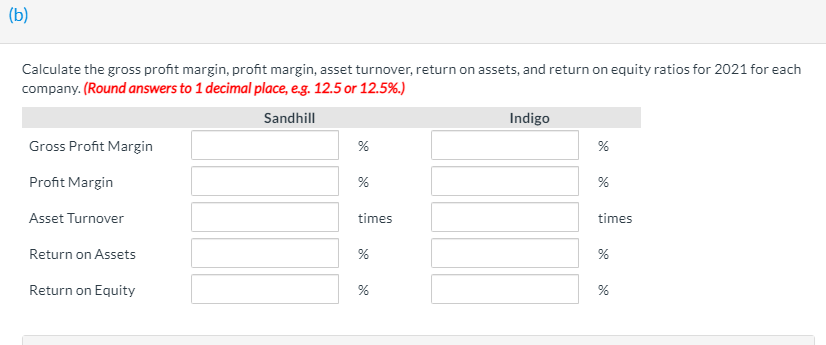
Comparative income statement data for Sandhill Inc. and Indigo Ltd., two competitors, are shown below for the year ended December 31, 2021. Net sales Cost of goods sold Gross profit Operating expenses Profit from operations Interest expense Profit before income tax Income tax expense Profit Sandhill $1,960,000 1,109,360 850,640 509,600 341,040 6,960 334,080 100,224 $233,856 Indigo $548,000 339,760 208,240 88,228 120,012 1,252 118,760 29,690 $89,070 Additional information: Average total assets Average total shareholders' equity $970,000 776,000 $326,563 237,808 (b) Calculate the gross profit margin, profit margin, asset turnover, return on assets, and return on equity ratios for 2021 for each company. (Round answers to 1 decimal place, e.g. 12.5 or 12.5%.) Sandhill Indigo Gross Profit Margin % Profit Margin % Asset Turnover times times Return on Assets % % Return on Equity % %
Step by Step Solution
There are 3 Steps involved in it

Get step-by-step solutions from verified subject matter experts