

Question: Comparative Income Statement - Vertical Analysis (Illustration 13.12) Comparative Balance Sheet - Horizontal Analysis (Illustration 13.11) FILL IN THE VERTICAL ANALYSIS CHART AND HORIZONTAL CHART
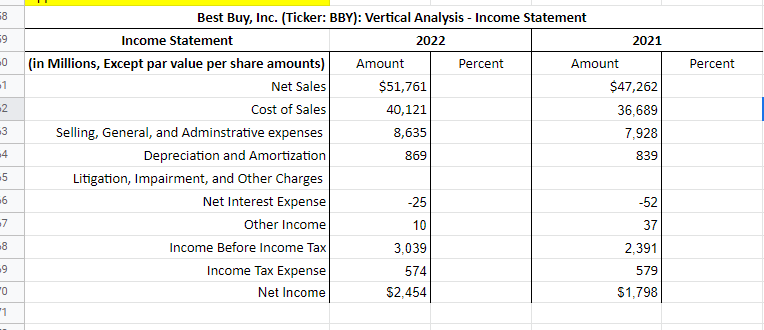
- Comparative Income Statement - Vertical Analysis (Illustration 13.12)
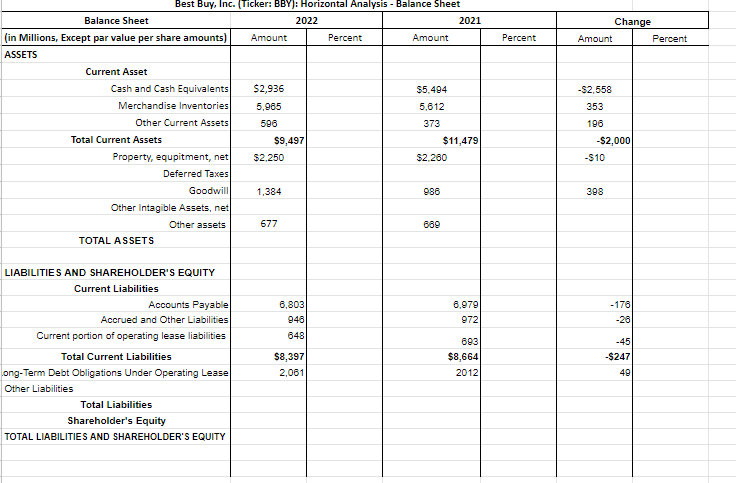
- Comparative Balance Sheet - Horizontal Analysis (Illustration 13.11)
- FILL IN THE VERTICAL ANALYSIS CHART AND HORIZONTAL CHART BELOW USING THE INCOME AND BALANCE SHEET STATEMENTS PROVIDED.
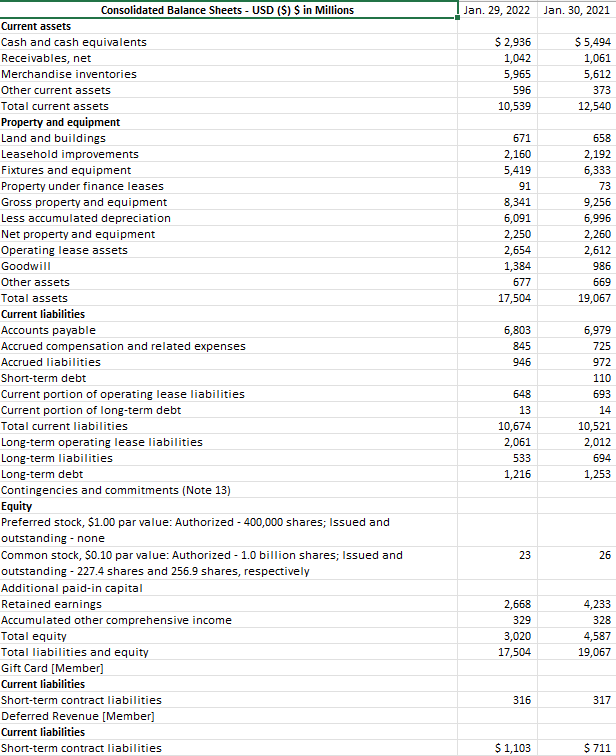
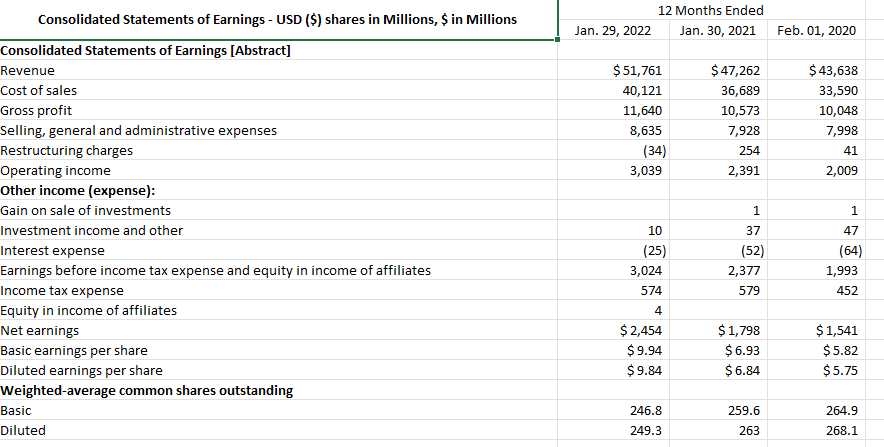
Jan. 29, 2022 Jan. 30, 2021 $ 2,936 1,042 5,965 596 10,539 $5,494 1,061 5,612 373 12,540 671 2,160 5,419 91 8,341 6,091 2,250 2,654 1,384 677 17,504 658 2,192 6,333 73 9,256 6,996 2,260 2,612 986 669 19,067 6,803 845 946 Consolidated Balance Sheets - USD ($) $ in Millions Current assets Cash and cash equivalents Receivables, net Merchandise inventories Other current assets Total current assets Property and equipment Land and buildings Leasehold improvements Fixtures and equipment Property under finance leases Gross property and equipment Less accumulated depreciation Net property and equipment Operating lease assets Goodwill Other assets Total assets Current liabilities Accounts payable Accrued compensation and related expenses Accrued liabilities Short-term debt Current portion of operating lease liabilities Current portion of long-term debt Total current liabilities Long-term operating lease liabilities Long-term liabilities Long-term debt Contingencies and commitments (Note 13) Equity Preferred stock, $1.00 par value: Authorized - 400,000 shares; Issued and outstanding - none Common stock, $0.10 par value: Authorized - 1.0 billion shares; Issued and outstanding - 227.4 shares and 256.9 shares, respectively Additional paid-in capital Retained earnings Accumulated other comprehensive income Total equity Total liabilities and equity Gift Card (Member] Current liabilities Short-term contract liabilities Deferred Revenue (Member) Current liabilities Short-term contract liabilities 648 13 10,674 2,061 533 1,216 6,979 725 972 110 693 14 10,521 2,012 694 1,253 23 26 2,668 329 3,020 17,504 4,233 328 4,587 19,067 316 317 $ 1,103 $ 711 12 Months Ended Jan. 30, 2021 Jan. 29, 2022 Feb. 01, 2020 $ 51,761 40,121 11,640 8,635 (34) 3,039 $ 47,262 36,689 10,573 7,928 254 2,391 $43,638 33,590 10,048 7,998 41 2,009 1 1 Consolidated Statements of Earnings - USD ($) shares in Millions, $ in Millions Consolidated Statements of Earnings [Abstract] Revenue Cost of sales Gross profit Selling, general and administrative expenses Restructuring charges Operating income Other income (expense): Gain on sale of investments Investment income and other Interest expense Earnings before income tax expense and equity in income of affiliates Income tax expense Equity in income of affiliates Net earnings Basic earnings per share Diluted earnings per share Weighted average common shares outstanding Basic Diluted 10 37 (52) 2,377 579 47 (64) 1,993 452 (25) 3,024 574 4 $ 2,454 $9.94 $9.84 $ 1,798 $6.93 $6.84 $ 1,541 $5.82 $5.75 246.8 249.3 259.6 263 264.9 268.1 Change Amount Percent Percent -$2,558 353 Best Buy, Inc. (Ticker: BBY): Horizontal Analysis - Balance Sheet Balance Sheet 2022 2021 (in Millions, Except par value per share amounts) Amount Percent Amount ASSETS Current Asset Cash and Cash Equivalents $2,936 $5,494 Merchandise Inventories 5.965 5.612 Other Current Assets 596 373 Total Current Assets $9,497 $11,479 Property, equpitment, net $2,250 $2.280 Deferred Taxes Goodwill 1,384 986 Other Intagible Assets, net Other assets 677 689 TOTAL ASSETS 196 -$2,000 -S10 398 6,803 948 8,979 972 - 176 -28 648 LIABILITIES AND SHAREHOLDER'S EQUITY Current Liabilities Accounts Payable Accrued and Other Liabilities Current portion of operating lease liabilities Total Current Liabilities ong-Term Debt Obligations Under Operating Lease Other Liabilities Total Liabilities Shareholder's Equity TOTAL LIABILITIES AND SHAREHOLDER'S EQUITY $8,397 2,061 693 $8,664 2012 -45 $247 49 68 69 0 Percent 1 -2 3 .4 Best Buy, Inc. (Ticker: BBY): Vertical Analysis - Income Statement Income Statement 2022 2021 (in Millions, Except par value per share amounts) Amount Percent Amount Net Sales $51,761 $47,262 Cost of Sales 40,121 36,689 Selling, General, and Adminstrative expenses 8,635 7,928 Depreciation and Amortization 869 839 Litigation, Impairment, and Other Charges Net Interest Expense -25 -52 Other Income 10 37 Income Before Income Tax 3,039 2,391 Income Tax Expense 574 579 Net Income $2,454 $1,798 -5 -6 7 8 .9 "O *1 Jan. 29, 2022 Jan. 30, 2021 $ 2,936 1,042 5,965 596 10,539 $5,494 1,061 5,612 373 12,540 671 2,160 5,419 91 8,341 6,091 2,250 2,654 1,384 677 17,504 658 2,192 6,333 73 9,256 6,996 2,260 2,612 986 669 19,067 6,803 845 946 Consolidated Balance Sheets - USD ($) $ in Millions Current assets Cash and cash equivalents Receivables, net Merchandise inventories Other current assets Total current assets Property and equipment Land and buildings Leasehold improvements Fixtures and equipment Property under finance leases Gross property and equipment Less accumulated depreciation Net property and equipment Operating lease assets Goodwill Other assets Total assets Current liabilities Accounts payable Accrued compensation and related expenses Accrued liabilities Short-term debt Current portion of operating lease liabilities Current portion of long-term debt Total current liabilities Long-term operating lease liabilities Long-term liabilities Long-term debt Contingencies and commitments (Note 13) Equity Preferred stock, $1.00 par value: Authorized - 400,000 shares; Issued and outstanding - none Common stock, $0.10 par value: Authorized - 1.0 billion shares; Issued and outstanding - 227.4 shares and 256.9 shares, respectively Additional paid-in capital Retained earnings Accumulated other comprehensive income Total equity Total liabilities and equity Gift Card (Member] Current liabilities Short-term contract liabilities Deferred Revenue (Member) Current liabilities Short-term contract liabilities 648 13 10,674 2,061 533 1,216 6,979 725 972 110 693 14 10,521 2,012 694 1,253 23 26 2,668 329 3,020 17,504 4,233 328 4,587 19,067 316 317 $ 1,103 $ 711 12 Months Ended Jan. 30, 2021 Jan. 29, 2022 Feb. 01, 2020 $ 51,761 40,121 11,640 8,635 (34) 3,039 $ 47,262 36,689 10,573 7,928 254 2,391 $43,638 33,590 10,048 7,998 41 2,009 1 1 Consolidated Statements of Earnings - USD ($) shares in Millions, $ in Millions Consolidated Statements of Earnings [Abstract] Revenue Cost of sales Gross profit Selling, general and administrative expenses Restructuring charges Operating income Other income (expense): Gain on sale of investments Investment income and other Interest expense Earnings before income tax expense and equity in income of affiliates Income tax expense Equity in income of affiliates Net earnings Basic earnings per share Diluted earnings per share Weighted average common shares outstanding Basic Diluted 10 37 (52) 2,377 579 47 (64) 1,993 452 (25) 3,024 574 4 $ 2,454 $9.94 $9.84 $ 1,798 $6.93 $6.84 $ 1,541 $5.82 $5.75 246.8 249.3 259.6 263 264.9 268.1 Change Amount Percent Percent -$2,558 353 Best Buy, Inc. (Ticker: BBY): Horizontal Analysis - Balance Sheet Balance Sheet 2022 2021 (in Millions, Except par value per share amounts) Amount Percent Amount ASSETS Current Asset Cash and Cash Equivalents $2,936 $5,494 Merchandise Inventories 5.965 5.612 Other Current Assets 596 373 Total Current Assets $9,497 $11,479 Property, equpitment, net $2,250 $2.280 Deferred Taxes Goodwill 1,384 986 Other Intagible Assets, net Other assets 677 689 TOTAL ASSETS 196 -$2,000 -S10 398 6,803 948 8,979 972 - 176 -28 648 LIABILITIES AND SHAREHOLDER'S EQUITY Current Liabilities Accounts Payable Accrued and Other Liabilities Current portion of operating lease liabilities Total Current Liabilities ong-Term Debt Obligations Under Operating Lease Other Liabilities Total Liabilities Shareholder's Equity TOTAL LIABILITIES AND SHAREHOLDER'S EQUITY $8,397 2,061 693 $8,664 2012 -45 $247 49 68 69 0 Percent 1 -2 3 .4 Best Buy, Inc. (Ticker: BBY): Vertical Analysis - Income Statement Income Statement 2022 2021 (in Millions, Except par value per share amounts) Amount Percent Amount Net Sales $51,761 $47,262 Cost of Sales 40,121 36,689 Selling, General, and Adminstrative expenses 8,635 7,928 Depreciation and Amortization 869 839 Litigation, Impairment, and Other Charges Net Interest Expense -25 -52 Other Income 10 37 Income Before Income Tax 3,039 2,391 Income Tax Expense 574 579 Net Income $2,454 $1,798 -5 -6 7 8 .9 "O *1
Step by Step Solution
There are 3 Steps involved in it

Get step-by-step solutions from verified subject matter experts