

Question: Compare bundle A and bundle B. In particular, commenton the levels of expenditure and utility using the given below (in the picture) Table 1: Parameter
Compare bundle A and bundle B. In particular, commenton the levels of expenditure and utility using the given below (in the picture)
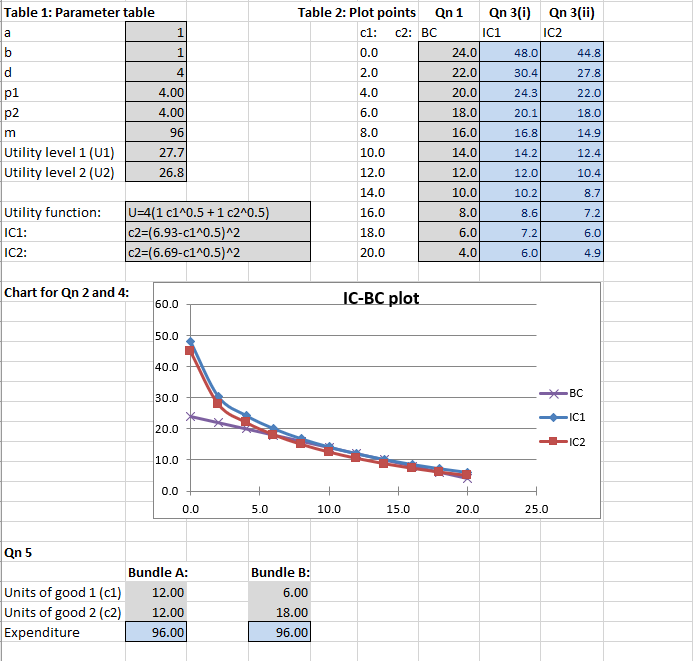
Table 1: Parameter table Table 2: Plot points Qn 1 Qn 3(i) Qn 3(ii) 1 C1: C2: BC IC1 IC2 1 0.0 24.0 48.0 44.8 d 4 2.0 22.0 30.4 27.8 p1 1.00 4.0 20.0 24.5 22.0 p2 4.00 6.0 18.0 20.1 18.0 m 96 8.0 16.0 16.8 14.9 Utility level 1 (U1) 27.7 10.0 14.0 14.2 12.4 Utility level 2 (U2) 26.8 12.0 12.0 12.0 10.4 14.0 10.0 10.2 8.7 Utility function: U=4(1 c1^0.5 + 1 c2^0.5 16.0 3.0 8.6 7.2 IC1: c2=(6.93-c1^0.5)^2 18.0 5.0 7.2 6.0 IC2: c2=(6.69-c1^0.5)^2 20.0 1.0 6.0 1.9 Chart for Qn 2 and 4: 60.0 IC-BC plot 50.0 40.0 30.0 BC 20.0 IC1 IC2 10.0 0.0 0.0 5.0 10.0 15.0 20.0 25.0 Qn 5 Bundle A: Bundle B: Units of good 1 (c1) 12.00 6.00 Units of good 2 (c2) 12.00 18.00 Expenditure 96.00 96.00
Step by Step Solution
There are 3 Steps involved in it

Get step-by-step solutions from verified subject matter experts